


.png)
TABLE OF CONTENTS
NVIDIA H100 SXM GPUs On-Demand
Key Takeaways
- Kimi K3 is 2.8T parameters with 104B active, 16 of 896 experts per token, and a 1.56 TB MXFP4 checkpoint across 96 shards.
- Tensor parallelism must divide the 96 attention heads and the 7168 hidden size, so 32 is the only shape that fits an 80 GB card.
- On Hopper the MXFP4 experts run through the Marlin W4A16 kernel, because the native MXFP4 backends target NVIDIA Blackwell.
- SGLang served it eleven minutes after launch on all 32 NVIDIA H100 GPUs, at the full one million token context.
- Chat, agentic tool calling, preserved thinking history and native vision all worked, at $64.00 per hour on Spot.
Kimi K3 is Moonshot AI's 2.8 trillion parameter flagship, and since the weights were published on 27 July 2026 anyone can serve it themselves. It is a sparse Mixture-of-Experts model built on Kimi Delta Attention and Attention Residuals, activating 104 billion parameters through 16 of 896 experts per token, with native vision through MoonViT-V2 and a one million token context window. The checkpoint ships in native MXFP4, and when we pulled it the 96 safetensors shards measured 1,560.94 GB. That one number decides everything about serving it. The official vLLM recipe and the vLLM launch blog both put the floor at Blackwell: at least one 8x NVIDIA B300 node, or an NVIDIA GB300 NVL72, with 16x NVIDIA B200 also supported. NVIDIA H100 is not on that list.
This guide serves Kimi K3 on NVIDIA H100 anyway: 32 NVIDIA H100 80GB GPUs across four Hyperstack nodes, tensor parallel 32, expert parallel 32, at $64 per hour. Every log line, memory figure and timing below comes from a single run on 28 July 2026 that reached a live endpoint eleven minutes after the containers started, then answered chat, called two tools in one turn, read an image and returned its chain of thought, with the full one million token context window intact. If you have read our technical deep dive into Kimi K3, this is the deployment half of that story: the arithmetic that fixes the cluster shape, the launch command, and what the model does once it answers.
Kimi K3 in the Numbers That Decide a Deployment
Before any hardware is booked, five figures from the model card set the shape of the deployment: the parameter count, the activated parameter count, the quantisation format, the layer composition and the context window. Everything else in this guide follows from them.
Inside Kimi K3
Ninety-three layers, sixty-nine of them Kimi Delta Attention and twenty-four Gated MLA, with a Stable LatentMoE block that lights up sixteen of eight hundred and ninety-six experts per token.
Figures read from the moonshotai/Kimi-K3 model card and from our own download and server logs. The checkpoint size is measured, not estimated. The weights carry Moonshot AI's own Kimi K3 licence rather than a stock open-source licence, so read it before building a commercial service on top.
Two of those rows are worth pausing on. MXFP4 stores roughly four bits per parameter plus a shared block scale, so 2.8 trillion parameters land at about 1.4 TB before overheads, and at 1.56 TB in practice once every tensor and the vision tower are counted. 16 of 896 is an extreme sparsity ratio, and it is why a 2.8 trillion parameter model has a compute cost closer to a 104 billion parameter one. The memory cost, however, is the full 2.8 trillion, because every expert has to be resident somewhere.
What one token actually touches
Kimi K3 is dense in memory and sparse in compute. Both bars are the same model, measured two different ways.
The consequence for a deployment: size the cluster from the full bar, and expect the throughput of the sliver. Every one of the 896 experts has to be resident on some GPU, even though only 16 of them run for any given token.
For context on what that memory buys, here is Kimi K3 against the strongest proprietary models on a representative slice of the published results.
Kimi K3 against the leading proprietary models
Six benchmarks spanning coding, agentic browsing, reasoning and document understanding. Higher is better on every row.
Source: the Kimi K3 release blog benchmark table. See the footnotes there for per-benchmark harness details.
The architecture you are about to shard across 32 GPUs
Kimi K3 is built on two architectural updates. Kimi Delta Attention gives the model an efficient foundation for scaling attention along sequence length, and Attention Residuals retrieve representations selectively across depth rather than accumulating them uniformly. The Mixture-of-Experts block is a Stable LatentMoE, trained stable at this sparsity by four techniques: Quantile Balancing, which derives expert allocation from router-score quantiles instead of a heuristic; Per-Head Muon, which optimises attention heads independently; the Sigmoid Tanh Unit for activation control; and Gated MLA for attention selectivity.
The Kimi K3 architecture
The Stable LatentMoE and Kimi Delta Attention modules on the left, the AttnRes operation α at the top right, and the Block Attention Residuals backbone on the right. Source: Kimi K3 release blog, Moonshot AI.
Kimi K3 also produced a motion-graphics explainer of its own architecture, which is worth watching before you shard it across 32 GPUs.
A 3Blue1Brown-style explainer of the Kimi K3 architecture, made by Kimi K3. Video: Moonshot AI, Kimi K3 release blog.
Why 1.56 TB of MXFP4 Does Not Fit Where You Expect
Read this section before provisioning anything, because it decides the shape of the cluster and it is where most of the money goes.
Start with the weights
MXFP4 packs four bits per parameter plus a shared exponent per block, so 2.8 trillion parameters imply roughly 1.4 TB before any overhead. The download settles the question exactly. Our verification script walked the Hugging Face manifest, resolved every symlink and added up the real bytes on disk on each of the four nodes:
That is 1,560,936,091,448 bytes across 96 shards, identical on all four nodes, and it is the number every later calculation uses. It is worth pausing on the second half of that sentence, because a tensor-parallel deployment does not split the download the way it splits the model.
Ninety-six shards, four times over
Tensor parallelism shards the model across GPUs at load time, but every node still needs the complete checkpoint on its own disk first, because each rank reads its slice of every tensor locally.
The nodes do not wait for each other, so the wall clock is one download rather than four. It is the disk and the network on every node that has to carry the full 1.56 TB.
Now count the GPUs
An NVIDIA H100 "80GB" card is a rounded label. On our nodes nvidia-smi reported 81,559 MiB, which is 79.65 GiB, and the PyTorch allocator counted a total capacity of 79.19 GiB per card. Thirty-two of them come to about 2,534 GiB, or roughly 2.72 TB.
Set 1.56 TB of weights against 2.72 TB of memory and the deployment fits, with about 1.16 TB left for the KV cache, the recurrent state that Kimi Delta Attention needs, the activations, the CUDA context and the communication buffers. That arithmetic is what makes 32 NVIDIA H100 GPUs the right shape for this model, and the measured per-GPU budget later in this guide lands almost exactly where it predicts.
The checkpoint against the cluster
Thirty-two NVIDIA H100 cards, four nodes, one model. The bar is the whole cluster, and the shaded part is what the weights claim before the engine asks for anything.
The four node markers are there to make the point that no single node holds the model. A quarter of the shaded region lives on each machine.
Why adding more NVIDIA H100 GPUs does not help
The obvious response to a tight fit is to add nodes. On Kimi K3 that does not work, and the reason is arithmetic rather than budget. Tensor parallelism has to divide the model evenly, which means it has to divide both the 96 attention heads and the 7168 hidden size. The greatest common divisor of 96 and 7168 is 32, so the valid tensor-parallel sizes are 1, 2, 4, 8, 16 and 32, and no more. A tensor-parallel size of 64 would ask for 1.5 attention heads per rank.
Why tensor parallelism has to be exactly 32
Two tests have to pass at once. The size has to divide the 96 attention heads and the 7168 hidden size into whole numbers, and it has to leave the weights under 79.19 GiB per card.
Weights per card is the 1,453.7 GiB checkpoint divided evenly, before the engine adds anything of its own. Sizes below 8 divide cleanly too, and put even more on each card.
So TP 32 is not the largest shape that happens to work. It is the only one that clears both tests, and four nodes of eight NVIDIA H100 GPUs is the only way to reach it on this generation. Adding a fifth node cannot lower the per-GPU weight load, because 40 does not divide 96 either, and data parallelism replicates the model rather than sharding it. If TP 32 does not fit, the answer is a larger card, not a longer invoice.
The same divisibility rule is why the published guidance points at NVIDIA B300, NVIDIA GB300 and NVIDIA H200: every entry on those lists carries more than 80 GB per GPU. If you are planning capacity rather than experimenting, NVIDIA H200 SXM at 141 GB per card and NVIDIA Blackwell reservations are the routes that remove this constraint entirely.
One Model, Four Machines: the 32-GPU Topology
Kimi K3 has no sanctioned pipeline-parallel strategy, so a multi-node deployment runs tensor parallelism across the node boundary, with expert parallelism laid over the top. That is a different shape from the one we used for Tencent Hy3, where pipeline parallelism kept the heavy collectives inside each node and put a single activation tensor on the wire. Here every rank participates in every layer, so the topology is flat: thirty-two equal ranks, one process group, one model.
Three things follow from that, and they shape every command in the deployment steps below. All four nodes have to sit in the same environment, because that is what puts them on a shared private network. Collectives are pinned to that private interface with NCCL_SOCKET_IFNAME and run over TCP sockets, since on-demand nodes are joined by ordinary Ethernet rather than InfiniBand. And every node needs its own full copy of the weights on local NVMe, because each rank loads its shard of every tensor from disk.
Thirty-two equal ranks
Every rank holds one thirty-second of every layer and one thirty-second of the experts. Rank 0 additionally runs the HTTP server. There is no head-only and follower-only split in the weights: the work is symmetric.
a quarter of the model resident · 70,960 MiB in use per GPU
same launch command · 70,960 MiB in use per GPU
same launch command · 70,960 MiB in use per GPU
same launch command · 70,960 MiB in use per GPU
Tensor parallel 32 and expert parallel 32 give a world size of 32. Per-GPU memory is read from nvidia-smi across all four nodes after the server reported ready.
The Kernel Path on Hopper, and the Settings That Fit 1.56 TB
This deployment uses SGLang, which publishes a Kimi K3 cell for four NVIDIA H100 nodes in its deployment cookbook. Two things about that configuration are worth understanding before you run it, because they explain both the flags and the performance.
MXFP4 weights, a mixed-precision kernel
Kimi K3 stores its expert weights in MXFP4, and the MoE backends that execute 4-bit weights natively are built around Blackwell FP4 hardware, which is why the published guidance points at NVIDIA B300 and NVIDIA GB300. On Hopper the expert matrix multiplies run instead through Marlin, the mixed-precision W4A16 kernel that multiplies 16-bit activations by 4-bit weights and hides the dequantisation cost behind the matrix multiply itself. The engine announces the choice on the first line of weight loading:
What Marlin does on every expert matrix multiply
Two operands of different widths meet in one kernel. The 4-bit weights never become 16-bit tensors in memory, only inside the multiply, which is what keeps the resident footprint at the size of the checkpoint rather than four times it.
On Blackwell the same weights are multiplied in FP4 without the dequantisation step at all, which is the difference the throughput section quantifies.
That single line in the log explains the throughput figures later in this guide. It is also why --moe-runner-backend marlin appears in the launch command rather than being left to auto: on Hopper it is the path that runs, so it is worth stating.
Three settings that keep the load inside the budget
Loading 1.56 TB through 32 allocators at once is the part of this deployment that is sensitive to configuration. Three of the settings in the launch command exist for exactly that, and they are the ones to keep if you change anything else:
PYTORCH_CUDA_ALLOC_CONF=expandable_segments:Trueswitches the PyTorch caching allocator onto CUDA virtual memory management, so segments grow and shrink in place instead of being pinned as separatecudaMallocblocks that can never merge. On a load that streams 96 shards through the allocator, that is what keeps the resident footprint close to the size of the weights themselves.--ep-size 32states expert parallelism explicitly rather than leaving it to be inferred, so each rank holds exactly its own slice of the 896 experts and no more.--mem-fraction-static 0.85sizes the static pool, and it is the single lever to reach for if you want a larger KV cache or more headroom.
With those in place the load runs to completion, and the head node reports where every gigabyte went. The log arrives in four stages, and each one answers a different question.
First, the cluster forms. The tokeniser loads, then all 32 ranks find each other and agree on the process group. Forty-one seconds for a rendezvous across four machines is normal, and almost no memory has been touched yet:
Then the weights load. This is the long part, and the middle line is the kernel choice from the section above. Note the pair of numbers at either end: 78.23 GB available before, 18.60 GB after, so the weights themselves cost 59.63 GB per card:
Next the memory pools. The KV cache is only 3.62 GB, but available memory falls by 7.03, and the difference is the recurrent state that Kimi Delta Attention keeps per sequence. The attention backends are chosen here too, one for decode and a different one for prefill:
Finally the server comes up. The line to read is the first one, because it is where the engine states what it will actually accept:
Put those four stages together and the per-GPU budget is settled: 59.63 GB of weights, 7.03 of pools, about 1.2 for CUDA graph capture, and 10.34 GB still free. Across all 32 cards nvidia-smi showed 70,960 MiB in use of 81,559 MiB, and the server advertised the full context_len=1048576.
Per-GPU memory budget on a single NVIDIA H100
Where each of the 32 cards spends its 78.23 GB, measured at the moment the server reported ready.
Read from the SGLang memory log lines quoted above. The 10.34 GB left over is what pays for longer prompts and more concurrent requests, and it is what --mem-fraction-static moves.
The free-memory line is the one to watch. available_gpu_mem at startup tells you how much room the deployment has left before anything else is added. Ten gigabytes per card is comfortable for this configuration, and it is the budget that CUDA graphs, a larger KV cache or speculative decoding would come out of.
How to Deploy Kimi K3 on Hyperstack
Now, let us walk through the step-by-step process of standing up the four-node cluster and serving Kimi K3 across all 32 GPUs.
If you would rather orchestrate this with Kubernetes, we have deployed comparable multi-node MoE models with managed Kubernetes and LeaderWorkerSet: Quick Start Guide: Deploying LLMs with Kubernetes on Hyperstack. For the parallelism theory behind the topology above, see How to Run Distributed Inference with vLLM.
Step 1: Accessing Hyperstack
First, you will need an account on Hyperstack.
- Go to the Hyperstack website and log in.
- If you are new, create an account and set up your billing information. Our documentation can guide you through the initial setup.
Step 2: Deploying Four 8x NVIDIA H100 Virtual Machines
From the Hyperstack dashboard, launch four identical GPU virtual machines. The node count is fixed by the tensor-parallel arithmetic above: tensor parallel 32 needs 32 GPUs, and nothing smaller divides the model.
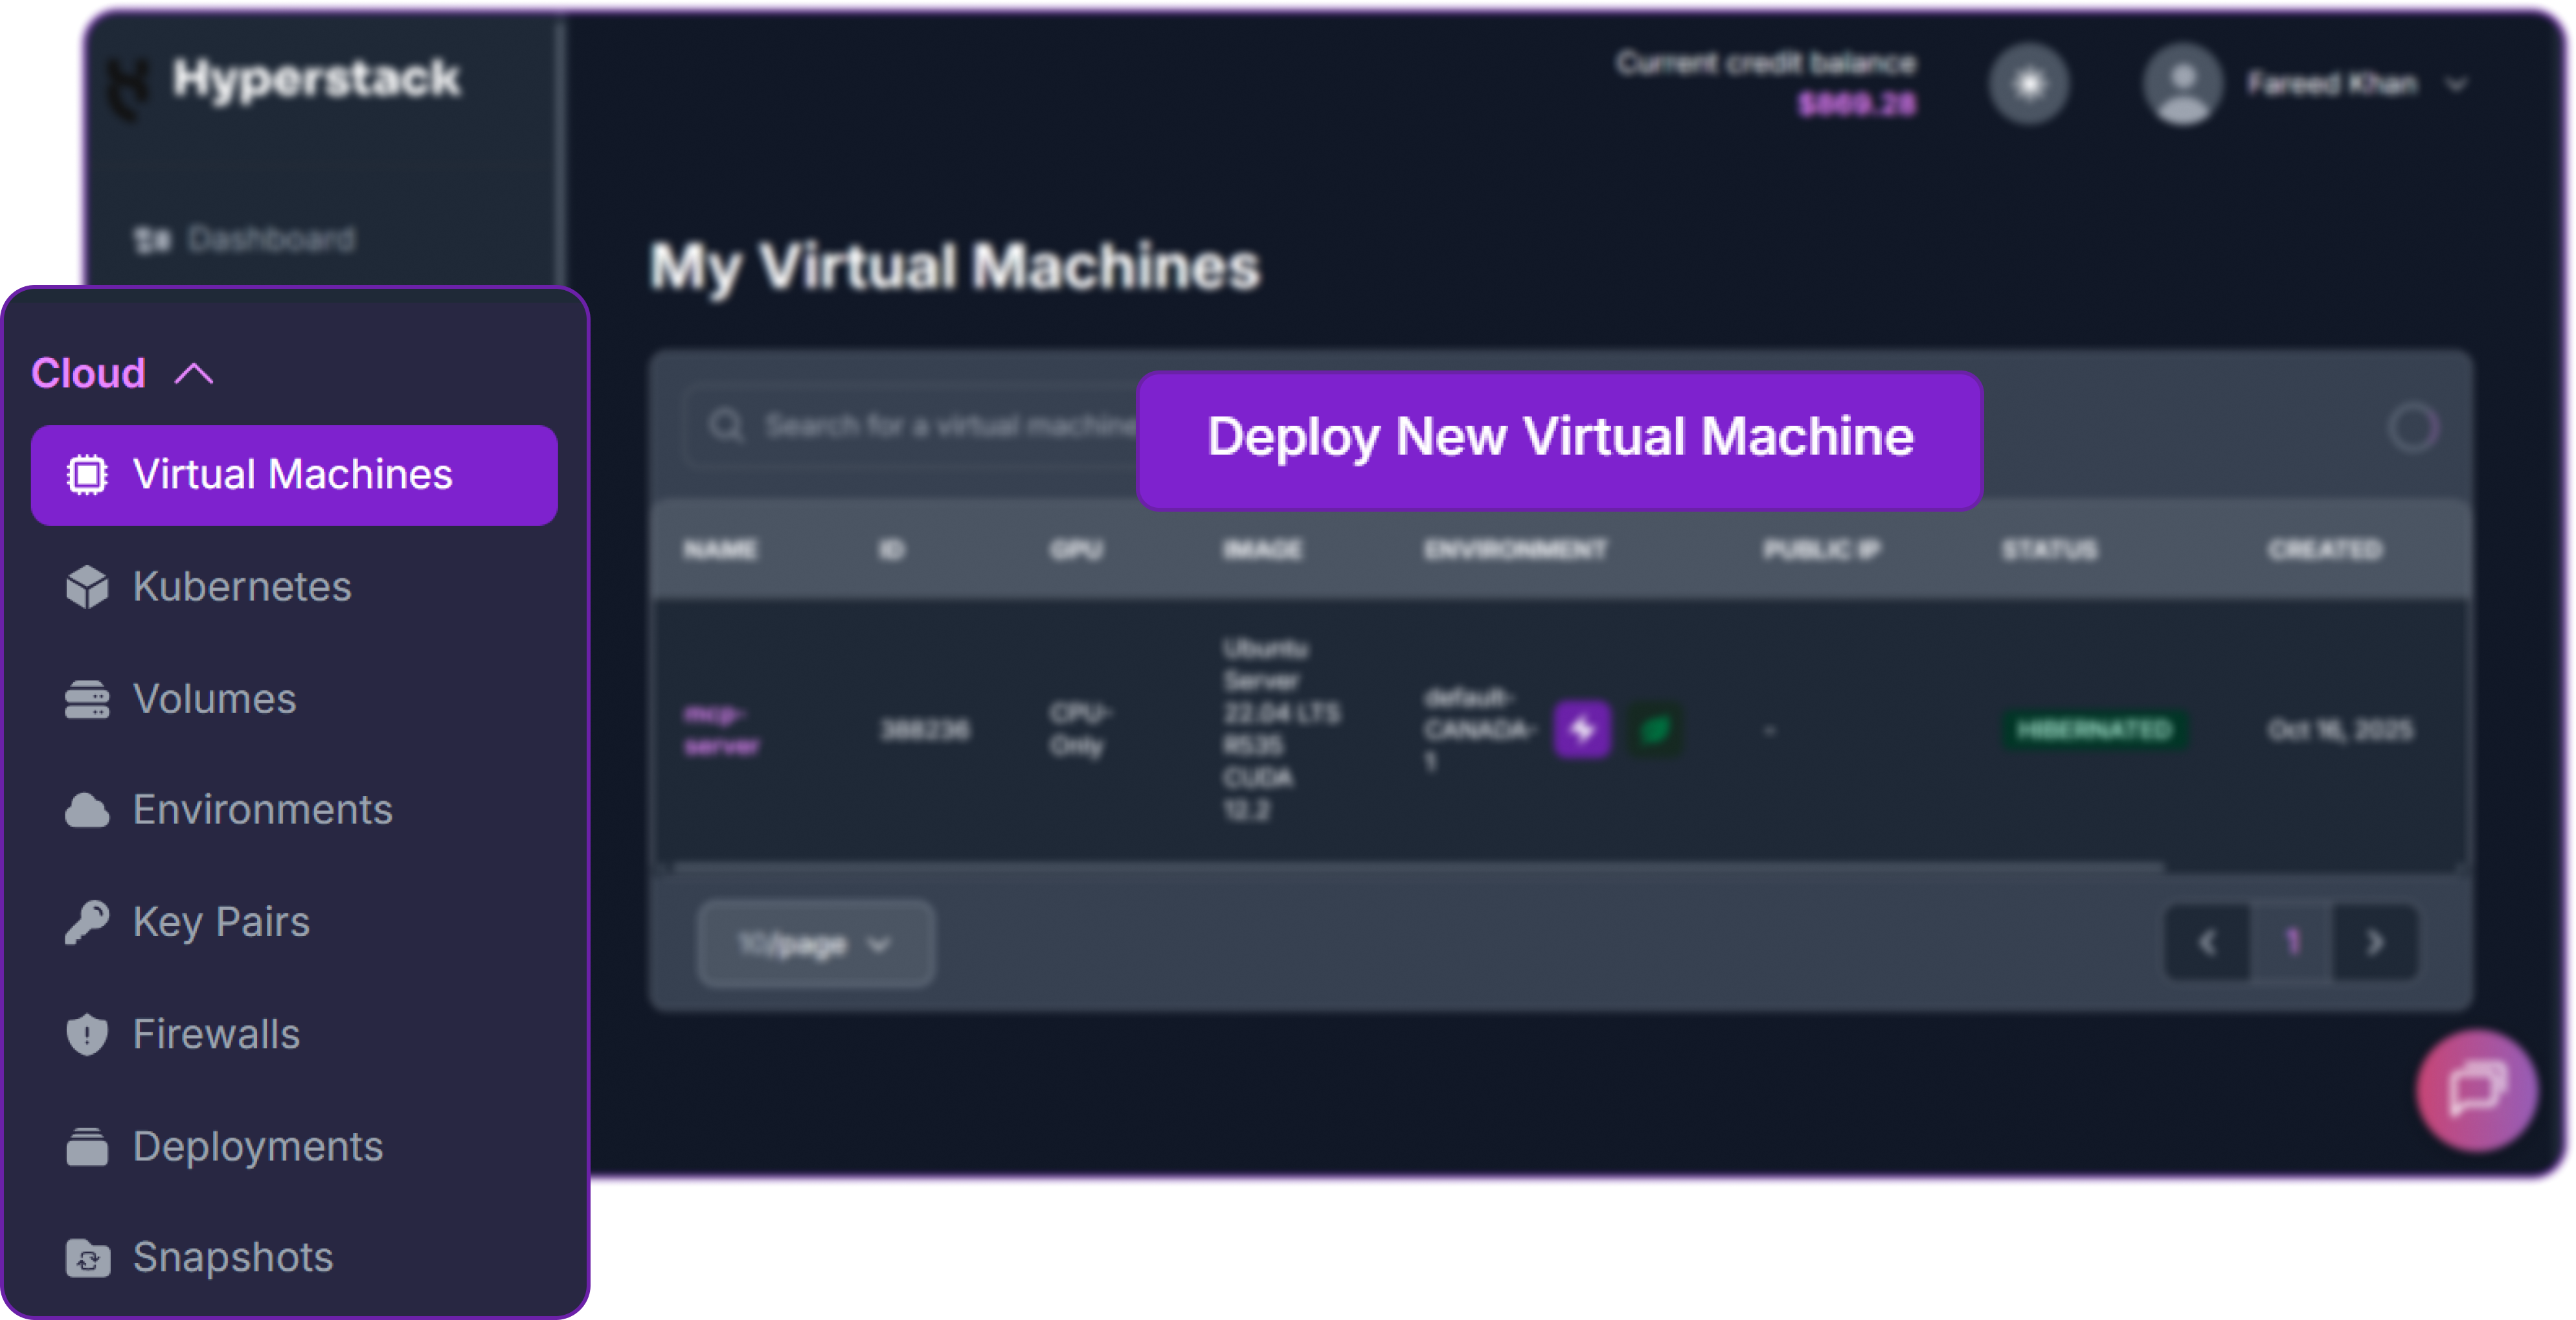
- Initiate Deployment: Click the "Deploy New Virtual Machine" button on the dashboard.
- Select Hardware Configuration: Choose an 8x NVIDIA H100-80G-PCIe-NVLink flavour, listed in the flavour reference as
n3-H100x8-NVLink. Our run used the Spot variant,n3-H100x8-NVLink-spot, at $2.00 per GPU per hour, which is $16.00/hr per node and $64.00/hr for the cluster. Take the NVLink variant rather than plain PCIe: per NVIDIA's H100 PCIe product brief it bridges each card to a single adjacent card at 600 GB/s, andnvidia-smi topoconfirmed the NV12 pairs on our nodes.

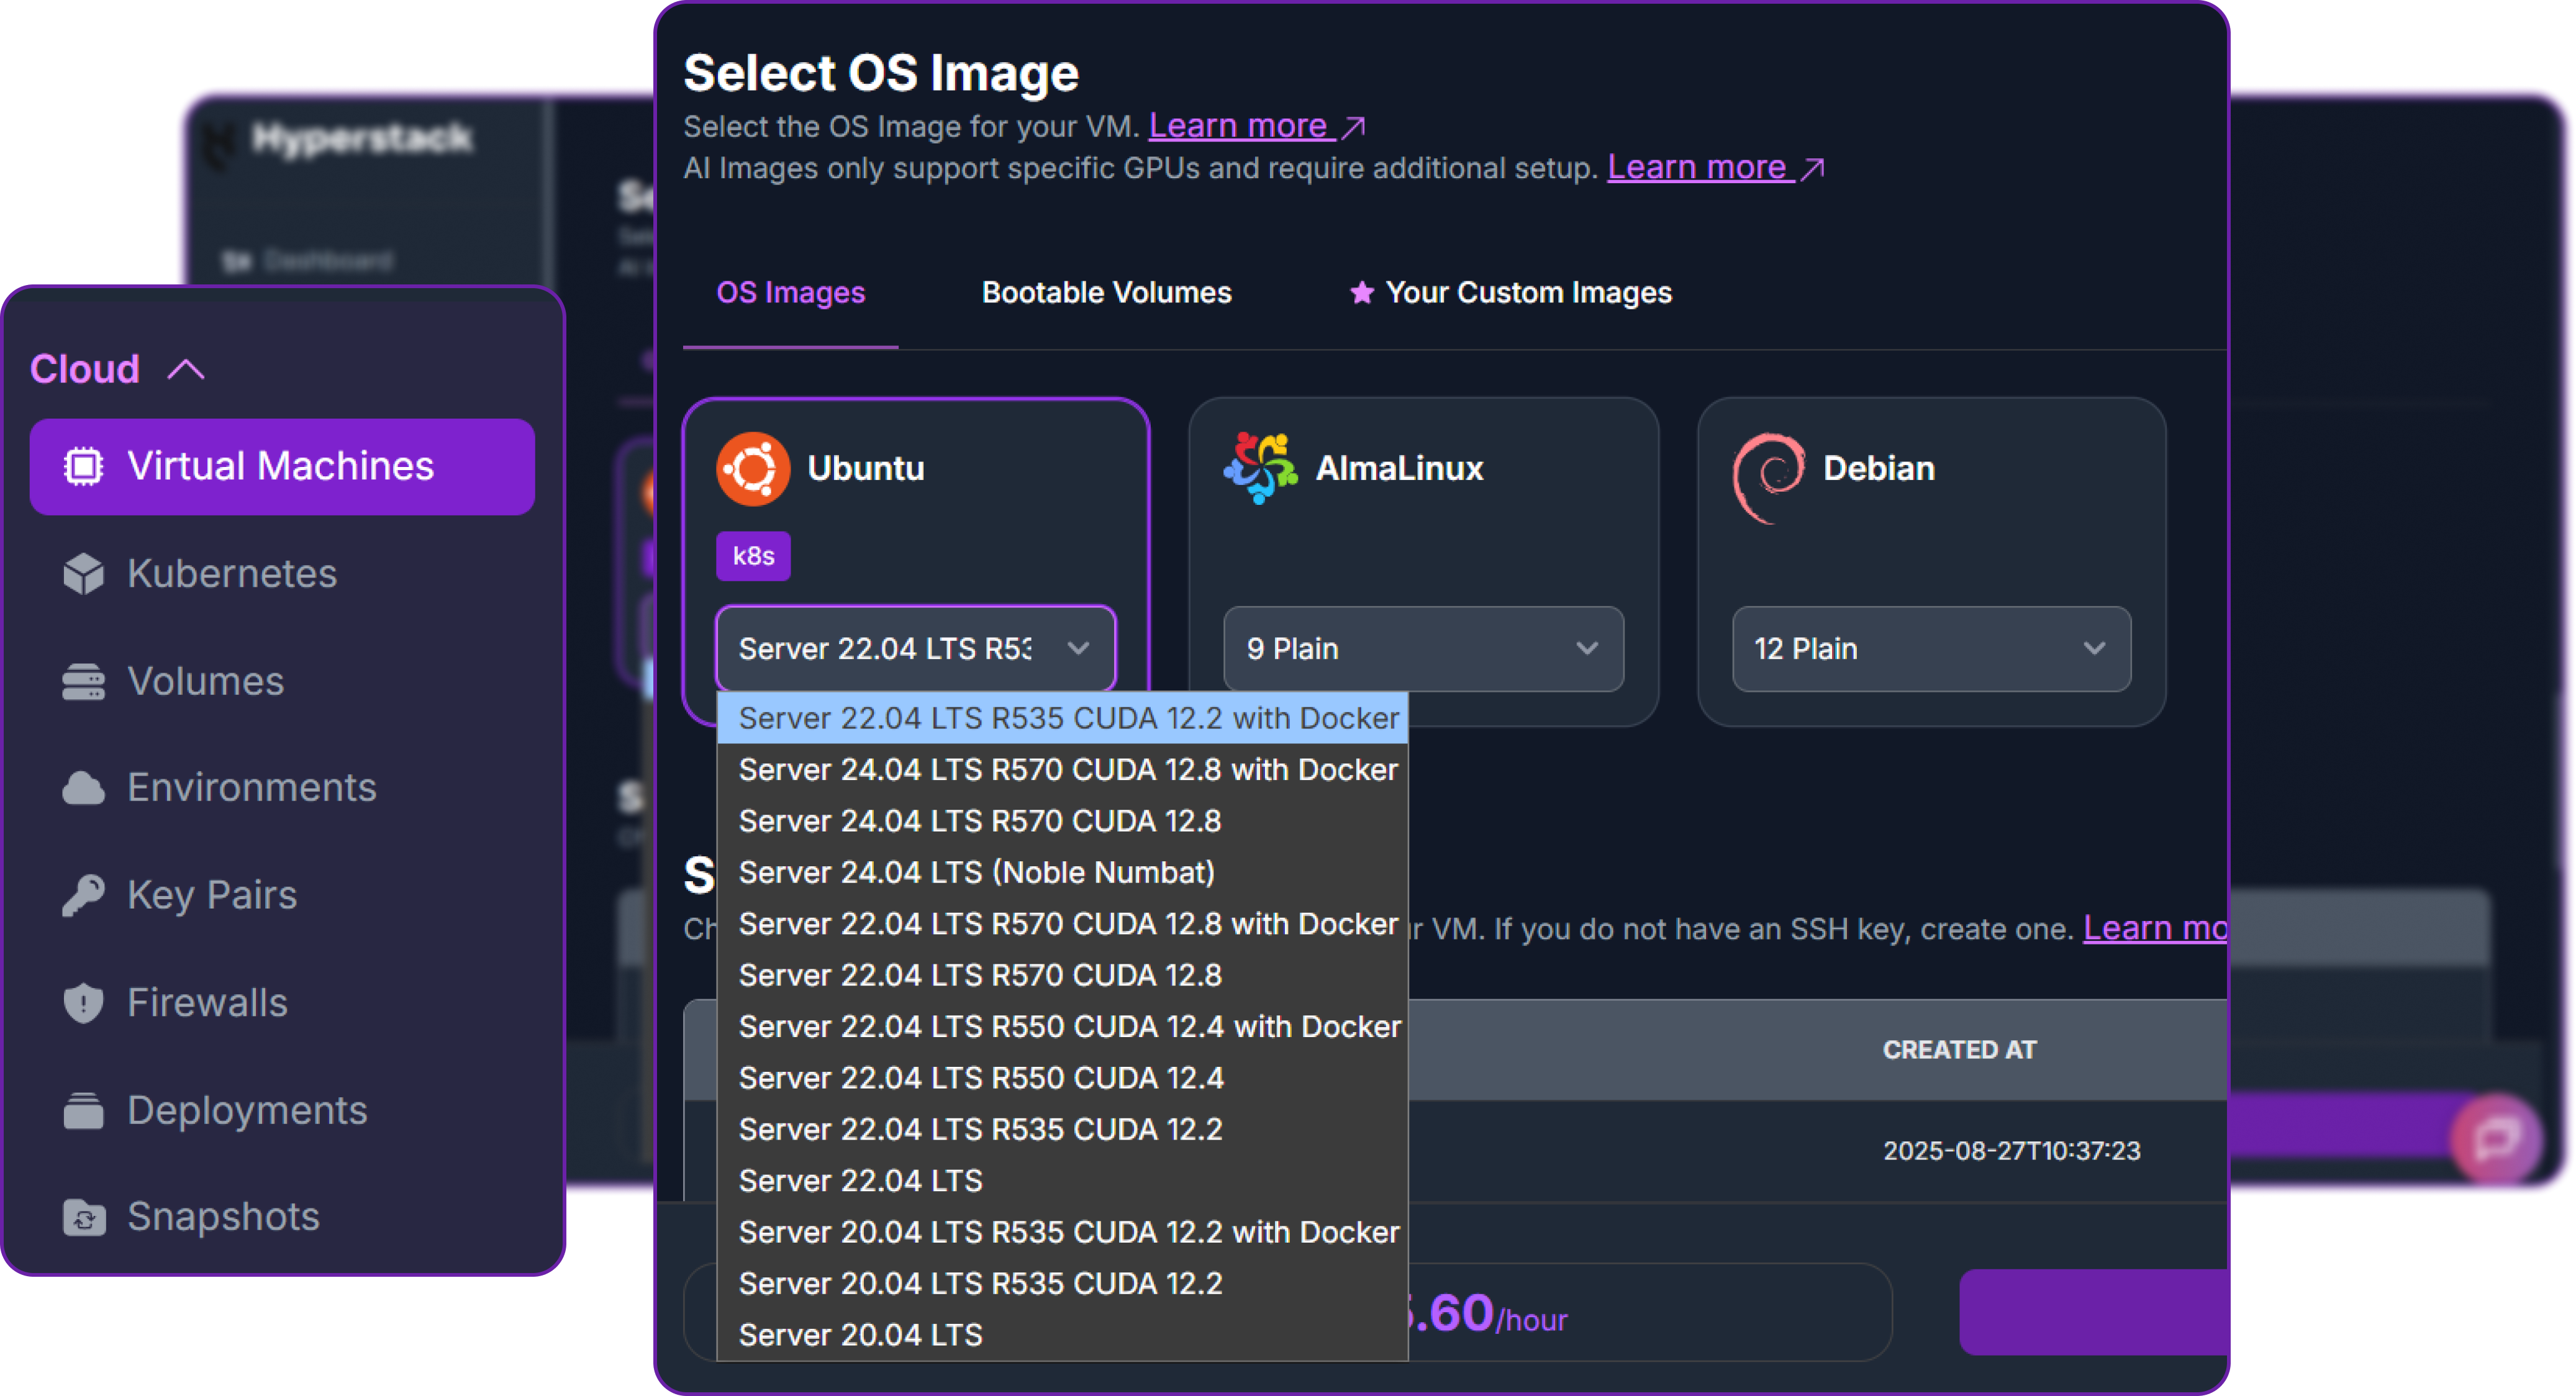
- Choose the Operating System: Select the "Ubuntu Server 24.04 LTS R570 CUDA 12.8 with Docker" image. The driver line has to match what the engine container expects, and this image also ships Docker and the NVIDIA container runtime ready to use.
- Environment: Choose an environment carrying NVIDIA H100 NVLink stock. Our run used
CANADA-1. All four nodes must land in the same environment, because that is what puts them on a shared private network, and the entire deployment depends on it. - Select a Keypair: Choose an existing SSH keypair. Use the same keypair for all four nodes.
- Network Configuration: Assign a Public IP to every node so you can reach them over SSH, and note each node's private IP once it is running.
- Review and Deploy: Check the settings, click "Deploy", and repeat until all four nodes exist with identical settings.
Spot capacity suits this workload well, with one condition. Spot VMs run on surplus capacity at a lower rate and can be reclaimed when that capacity is needed, so treat the cluster as disposable and capture any output you care about as you go. For an evaluation run like this one it turns a $80/hr cluster into a $64/hr cluster.
Step 3: Configure the Firewall
The four nodes have to talk to each other freely on the private network, and you need to reach the API from your own machine. Add these firewall rules:
| Port | Source | Why |
|---|---|---|
| 22 | your public IP /32 | SSH access to all four nodes |
| 8000 | your public IP /32 | The inference API, on the head node only |
| 1 to 65535 TCP | the other nodes' private IPs | NCCL, Gloo and the torch.distributed rendezvous on port 20000 |
Every node's private IP is shown on its detail page in the dashboard, so you can fill in that third rule without logging in anywhere. It is also the rule people forget. NCCL negotiates its ports dynamically, so pinning it to a single port does not work and the range has to be wide. The source does not have to be wide, though. Scope it to the peer nodes' private addresses, or at most to your environment's own subnet, rather than to the whole 10.0.0.0/8 range: a cloud private network is shared, and "not reachable from the internet" is not the same as "reachable only by my four machines".
The inference endpoint has no authentication. That is why every example here passes EMPTY as the key. Anything that reaches port 8000 has full use of a 2.8 trillion parameter model, so keep the rule scoped to your own IP and never open it to 0.0.0.0/0.
Step 4: Accessing Your Nodes
Once all four virtual machines are running, copy their Public IP addresses from the dashboard and connect to each in a separate terminal.
You will also need three pieces of information on every node: its private IP, the name of its private network interface, and confirmation that the large disk is mounted. Run this on all four:
On our NVIDIA H100 nodes the private interface was ens6 on the 10.0.0.0/24 subnet, and the head node's private IP was 10.0.0.219. Do not assume these values match yours. The interface name in particular varies by flavour, so read both from the commands above and substitute them wherever this guide shows ens6 or a 10.0.0.x address. Both values go into the launch command in Step 8, so it is worth writing them down now.
The disk check is what shapes the rest of the guide. The machine has two disks and only one of them matters here: the root filesystem is roughly 96 GB, while the multi-terabyte NVMe disk is mounted separately at /ephemeral and offers around 6.3 TB on this flavour. It is documented under ephemeral storage. Kimi K3 is 1.56 TB and the container image adds another 13.3 GB on top, so nothing about this deployment fits on the root disk.
Step 5: Point Docker and the Model Cache at /ephemeral
Two things have to move onto the big disk: the Hugging Face cache that will hold the weights, and Docker's own storage, because container images are pulled onto the root disk by default. Everything in this step runs on all four nodes.
Start with the directories. /ephemeral/hf becomes the Hugging Face cache, and it is the path that gets mounted into the container later so the engine finds the weights already present:
Next, move Docker itself. The data-root key tells the daemon to store images and layers on the NVMe disk rather than the 96 GB root partition, and it only takes effect on a restart:
Finally, clear anything Docker has already written to the root disk, then check both halves landed. On a fresh node the prune finds little to remove, and it earns its place when you are re-running on a node that has pulled images before. docker info should now report Docker Root Dir: /ephemeral/docker:
Prune first, then pull. Recent Docker releases also keep image layers under the containerd snapshotter at /var/lib/containerd, which data-root does not cover. Running the prune before the pull, and keeping an eye on df -h / while it runs, gives the 13.3 GB image the whole NVMe disk to work with.
Step 6: Download Kimi K3 and Pull the Engine Image
Every node needs its own complete copy of the weights, because every rank loads its shard of every tensor from local disk. The image pull and the model download are independent, so start them together on all four nodes. First make sure the Hugging Face client is present:
Kick off the image pull first, because it is the quicker of the two and nothing about it depends on the weights:
Then start the weights. Three details in this command are doing the work: HF_TOKEN authenticates the download, because Hugging Face applies tighter rate limits to anonymous traffic than to signed-in users, so a token is what sustains full speed across 1.56 TB; HF_HOME puts the cache on the NVMe disk rather than the root partition, which is the whole point of the previous step; and max_workers=16 is what fills the pipe.
Both are detached, so you can watch the disk fill rather than the terminal. On our nodes the transfer peaked at 1.8 GB/s and finished in about 32 minutes, an average of roughly 0.8 GB/s across the whole checkpoint:
The download is the long pole, and it is parallel. All four nodes pull at once and do not wait for each other, so the cluster is ready roughly 32 minutes after the last node starts downloading, not 128. Environment variable behaviour is documented in the huggingface_hub reference.
Step 7: Verify All 96 Shards Before You Serve
A 32-rank cluster spends about eleven minutes loading before it is in a position to notice that one of the 96 shards is short. Confirming the download first takes seconds on an idle node and gives you a definite answer before the expensive part begins, so it is worth the keystrokes on a checkpoint this size.
The script reads your token from ~/hf_token.txt, so save it there first with echo "$HF_TOKEN" > ~/hf_token.txt. It then builds in four parts, starting with the arguments and the header that authenticates the API call:
Next it asks Hugging Face what should be there. The repository metadata lists every file in the repo, and filtering it to .safetensors gives the 96 names to look for:
Then it finds the local copy. The downloader writes into a snapshot directory named after the commit hash and fills it with symlinks into the blob store, so the size of each link has to be read through os.path.realpath rather than from the link itself:
Finally it compares the two and exits non-zero if anything is missing, so the whole thing can go in front of your launch command:
Run it on every node. What you want to see, with the same snapshot hash on all four:
Step 8: Launch Kimi K3 Across All Four Nodes
Unlike a pipeline-parallel deployment, there is no separate follower command here. All four nodes run the same command, and only two values change between them: --node-rank and SGLANG_HOST_IP. Rank 0 is the head, and it is the only node that will answer HTTP, but it holds no more of the model than the others.
Set the five values first. Only the first two differ between machines, so the safest way to work is to open four terminals, paste this block into each, and change the two lines:
Next collect the engine arguments. Putting them in a variable keeps them separate from the container plumbing, and it makes the difference between the four nodes a single line rather than a diff across thirty:
Then launch. Everything here is container-level: the GPUs, host networking and shared memory, the weights mounted where the engine looks for them, and the environment the engine reads at start-up:
Start rank 0 first, then the other three within a minute or so of each other. The rendezvous on port 20000 waits for all four, and --dist-timeout 3600 gives it an hour before it gives up, which is deliberate on a load this size.
Here is what each part of those three blocks is for:
| Flag or variable | What it does |
|---|---|
| --tp-size 32 | Shards every layer across all 32 GPUs. The maximum this model permits. |
| --ep-size 32 | Spreads the 896 experts across the same 32 ranks, one slice each. |
| --nnodes 4 --node-rank | Cluster size, and this node's position in it. The only value that differs per node. |
| --dist-init-addr | The rendezvous point. All four nodes point at the head on port 20000. |
| --moe-runner-backend marlin | The W4A16 kernel that runs MXFP4 weights on Hopper. |
| --decode-attention-backend flashmla | The Hopper-tuned latent attention decode kernel. Prefill stays on FlashAttention 3. |
| --mem-fraction-static 0.85 | Size of the static memory pool. The lever if you need more or less KV cache. |
| --dist-timeout 3600 | Rendezvous patience. Loading 1.56 TB across four nodes is not quick. |
| --reasoning-parser kimi_k3 | Splits the chain of thought into a separate reasoning_content field. |
| --tool-call-parser kimi_k3 | Turns K3's tool tokens into standard OpenAI tool_calls. |
| --trust-remote-code | K3 ships its own tokeniser and processor classes in the repository. |
| PYTORCH_CUDA_ALLOC_CONF | expandable_segments:True. Keeps the resident footprint close to the size of the weights. |
| SGLANG_ENABLE_TP_MEMORY_INBALANCE_CHECK | Set to 0. Skips the balance assertion across ranks during load. |
| SGLANG_K3_ATTN_RES_MODE=jit | Compiles the Attention Residuals path just in time. |
| SGLANG_MOE_FUSED_GATE_RADIX=1 | Radix setting for the fused expert gate. |
| SGLANG_HOST_IP | The address this rank advertises to the other 31. Differs per node. |
| NCCL_SOCKET_IFNAME / GLOO_SOCKET_IFNAME | Pins collectives to the private interface, the one the rendezvous uses. |
| NCCL_IB_DISABLE=1 | Use TCP sockets. On-demand nodes have no InfiniBand. |
| --ulimit memlock=-1 | Unlimited pinned memory, the standard NVIDIA requirement for multi-node NCCL. |
| --network host --ipc=host | Host networking and shared memory for the eight worker processes per node. |
Keep the container permissions exactly as they are above. The --ulimit pair, --ipc=host and --network host grant everything multi-node NCCL needs here, so there is no reason to add --privileged. If you relaunch, run docker rm -f sgl on every node first and check with nvidia-smi --query-compute-apps=pid --format=csv that the GPUs are free.
Step 9: Verify the Deployment
Follow the head node while the cluster forms:
The timeline below is our run, from the first container log line to the readiness message. Four moments in it are the ones to watch for, and they carry a filled marker.
Eleven minutes from container start to live endpoint
Timestamps are taken verbatim from the head node log of the run described in this guide.
Weight loading is 48 per cent of the wall clock, and the four minutes between the memory pools and startup are CUDA graph capture across 32 ranks.
Now confirm the model is being served, from your own machine:
The max_model_len of 1,048,576 is the line to look for. A 2.8 trillion parameter model is live on 32 GPUs with its full one million token context window intact, not a truncated one.
Finally, look at the memory across all four nodes. This is 2.8 trillion parameters resident on thirty-two NVIDIA H100 GPUs:
Thirty-one of the thirty-two cards read 70,960 MiB of 81,559 MiB. One card reads 71,790 MiB, about 830 MiB more, which is consistent with the rank that also carries the HTTP server process. That leaves about 10.3 GB of headroom on every card, matching the engine's own available_gpu_mem=10.34 GB exactly. Kimi K3 is live.
Talking to Kimi K3
The endpoint is OpenAI compatible, so every example below is a standard chat completion. What is specific to Kimi K3 is not the transport but the behaviour: it always thinks, it returns that thinking in a separate field, and it expects you to hand that thinking back on the next turn.
The first request, and the field most clients ignore
The reply is a standard chat completion with one extra field. Here is the message it returned:
The answer is in content as usual, but reasoning_content is populated alongside it. That field exists because the server was launched with --reasoning-parser kimi_k3, and without it the thinking would arrive inline in the answer. Now look at what it cost:
reasoning_tokens reports 109 of the 135 completion tokens. On a question this small, 81 per cent of the generated tokens were thinking, and a client that reads only content pays for all of them while seeing none of them.
Every Python example from here on shares one small helper. It is the standard library only, so there is nothing to install, and it is the same request shape the shell examples above send:
With that in place a chat request is a dictionary. The only field that is not standard OpenAI is reasoning_effort, and it sits at the top level of the body rather than inside chat_template_kwargs as some other models expect:
Reading the reply is where the difference shows. The two halves come back on separate keys, so you can log the thinking and show the answer:
There is no way to switch thinking off. Kimi K3 accepts low, high and max, and nothing else. The no_think value that some other models accept is discarded, with a line in the server log saying so. Budget your token accounting accordingly.
Thinking effort: what the knob actually changes
The interesting question is not whether the effort setting works, but what it moves. We put the same word problem through at low and at high and compared the token accounting:
The token counts move sharply, and the wall clock with them:
The thinking itself is where the difference is visible. At low it is one line. At high the model restates the problem, solves it, checks the total and then considers whether non-integer amounts are acceptable:
Thinking effort scales the thinking, not the answer
The same three-variable word problem at low and at high effort. Both answers were correct and both were roughly the same length.
Reasoning tokens rose 3.4x from 54 to 184, while the visible answer grew by only eight per cent, from 148 to 160 tokens. Latency went from 33.6 s to 56.6 s.
That is a clean result for capacity planning. The effort setting is a latency and cost dial, not a verbosity dial. At low the model wrote a single compressed line of working. At high it restated the problem, solved it, checked the total and then explicitly considered whether non-integer amounts were acceptable. On a problem this size the extra thinking bought nothing, which is exactly the sort of thing worth measuring on your own workload before you default the whole fleet to max.
Preserved thinking history, which is a requirement rather than an option
Kimi K3 was trained in preserved thinking history mode. The model card is direct about what happens otherwise: if the harness fails to pass back the historical thinking content, or if a session running on another model is switched over to K3 mid-conversation, generation quality may become highly unstable. In practice that means the assistant message you append to messages has to carry reasoning_content as well as content and tool_calls.
Here is a probe that can only be answered correctly if the previous turn's thinking survived the round trip. Turn one is an ordinary request:
This next block is the one that matters. The assistant message goes back onto messages with its reasoning attached, rather than being rebuilt from content alone:
Turn two then asks about something that only ever existed inside that thinking:
The model read its own prior reasoning, correctly reported that it had not held back any alternatives, and offered three new numbers instead of inventing a memory. That is the behaviour you want, and it is the behaviour you lose if the assistant turn is rebuilt from content alone.
Most OpenAI-compatible client libraries drop unknown fields. If you rebuild the assistant turn from content and tool_calls alone, the reasoning is silently gone. Echo the message back whole, or add reasoning_content back explicitly as the examples here do.
Agentic tool calling with the kimi_k3 parser
Because the server was launched with --tool-call-parser kimi_k3, the model decides for itself when to reach for a tool and the parser converts its output into standard OpenAI tool_calls. The first of the two tools is a calculator, and it walks the expression as an abstract syntax tree rather than calling eval, so anything other than arithmetic raises a ValueError rather than reaching a shell:
The calculator itself recurses over that tree. Anything that is not a number or one of the five permitted operators raises rather than evaluating:
The second tool is a stub, and a dispatch map ties the two names back to the two functions:
Then describe the same two functions to the model. This is the standard OpenAI tools schema, with nothing Kimi-specific in it:
The second entry has the same shape, and the two go into the list the request will carry:
The loop itself is the usual pattern. Send the task, and stop as soon as a reply comes back without tool calls, because that reply is the answer:
If there were tool calls, the assistant turn goes back onto messages first, and it carries the same three things every time:
Then each requested tool runs and its result is appended as a tool message, which is what the model reads on the next pass:
Kimi K3 requested both tools in a single turn rather than serialising them into two round trips. Its reasoning for that turn, 116 characters of it, reads: "The user wants 47*89 and the weather in Tokyo. I should call both tools in the same block since they are independent."
The whole exchange took 36.25 seconds across two round trips. Parallel tool calls in one turn are the behaviour you want from an agentic model, and the kimi_k3 parser delivers it with no orchestration code of your own.
Native vision, tested against an image we generated ourselves
Kimi K3 is natively multimodal through MoonViT-V2, so images go into the same endpoint as text. Rather than describe a photograph and grade the answer by eye, we built the test image in the script: a 128 by 128 PNG whose left half is pure red and whose right half is pure blue, written byte by byte with nothing but the standard library. The correct answer is therefore known before the request is sent.
Sending it is the same call as any other, with the image as a second content part rather than a separate endpoint:
That answer is objectively correct, including the vertical boundary down the centre. The usage block is the interesting part for anyone budgeting a vision workload: the whole image cost 25 image tokens, and the request completed in 18.4 seconds. Vision on Kimi K3 is not a bolt-on adapter, and it is priced in tokens like everything else.
Throughput on 32 NVIDIA H100 GPUs
Single-stream decode across our three chat prompts averaged 5.8 tokens per second, with individual prompts at 5.9, 5.8 and 5.6. The more useful question for a sparse MoE with room for 49 concurrent requests is what happens when requests arrive together, so we fired four at once. The script is standard library only, so it runs anywhere:
One worker sends one request and records what it got back:
Then start all four at once and time the batch as a whole, which is the number that matters for a server rather than for a single user:
Single stream against four-way concurrency
Four parallel requests produced 2.4x the aggregate throughput of one, which is continuous batching amortising the routing and the cross-node collectives across concurrent work.
Measured end to end from the client, so prefill and queueing are included. The server log reports a raw decode rate of about 16.3 tokens per second at four running requests, which is the same result seen from the engine side.
What sets that figure, and what would move it
Those numbers come from a bring-up configuration, and every choice in it is a deliberate trade for a fast, cheap start rather than for peak throughput:
- The MoE path is Marlin. Every expert matrix multiply dequantises MXFP4 into 16 bits on the way through, because the native MXFP4 backends target Blackwell.
- The cards are PCIe rather than SXM. NVLink bridges pairs of cards, and the remaining hops inside each node go through the PCIe host bridge.
- Collectives run over Ethernet. Twenty-four of the thirty-two ranks sit on a different machine from rank 0, so their all-reduces cross the private network.
- Speculative decoding is off. Kimi K3 ships a draft path that the published recipes pair with the model, and we ran without it to keep the launch minimal.
- Every request thinks. Kimi K3 has no no-think mode, so even a one-line answer pays for a reasoning pass. On our first request that was 109 of 135 tokens.
For scale at the other end of the range, the vLLM launch blog reports 111 tokens per second per user on TP 8 and 118 on TP 16 at batch size 1, rising to 331 and 370 with DSpark speculative decoding, measured on NVIDIA GB300 NVL72. That is a different hardware class, with native FP4 kernels and NVLink across the whole domain, and the distance between the two is a fair picture of what each of the trades above is worth.
So this is the shape of deployment to reach for when the job is evaluation, integration and correctness work: proving an agent harness against the model itself, measuring how your prompts behave at each thinking effort, testing vision inputs, and validating the tool-call plumbing end to end, on hardware you can book by the minute. When throughput becomes the requirement, the levers in order of effect are more memory per card, then native FP4, then speculative decoding.
Kimi Delta Attention also changes prefix caching, which is where a long-context serving stack normally recovers its throughput. Moonshot AI has contributed a KDA prefix cache implementation to the vLLM community, and the official Kimi API reports a cache hit rate above 90 per cent in coding workloads on the back of it. As that lands in the open engines it will matter more to real workloads than any of the flags in this guide.
Cost and Tearing Down the Cluster
At $2.00 per GPU per hour on Spot, thirty-two NVIDIA H100 GPUs cost $64.00 per hour. Here is where that hour goes on a clean run that follows this guide:
| Phase | Wall clock | Cluster cost |
|---|---|---|
| Provision four nodes and prepare the disks | about 8 min | $8.53 |
| Download 1.56 TB on all four nodes in parallel | about 32 min | $34.13 |
| Verify 96 shards on every node | under 1 min | $1.07 |
| Launch and reach a live endpoint | 11 min | $11.73 |
| Total to a working 32-GPU endpoint | about 52 min | $55.46 |
The download dominates, at about 62 per cent of the bill, and it is the one phase that does not get cheaper with faster GPUs. Everything after it is minutes. Add whatever time you intend to spend actually using the endpoint on top, at roughly $1.07 per minute.
When you are finished, stop the containers and delete the virtual machines. This is the step you must not skip:
Nothing on this cluster survives deletion. The ephemeral disk holding the 1.56 TB checkpoint is released with the virtual machine, and Spot VMs cannot be hibernated or saved as a custom image. Capture every result you care about before you delete, and treat the download as something you will repeat rather than something you will keep.
Why Deploy Kimi K3 on Hyperstack?
Hyperstack is a cloud platform engineered specifically to accelerate AI and machine learning workloads. Here is why it suits a model the size of Kimi K3:
Kimi K3 permits a maximum tensor-parallel size of 32, so four 8x NVIDIA H100-80G-PCIe-NVLink nodes is the largest valid shape on this generation. Hyperstack provides them on demand, with no reservation queue.
A 1,560.94 GB checkpoint has to live somewhere fast, on all four nodes at once. The ephemeral NVMe disk at
/ephemeral held the weights and the 13.3 GB container image with room to spare, at a peak of 1.8 GB/s while filling.Kimi K3 has no sanctioned pipeline-parallel strategy, so multi-node serving means tensor parallelism on the wire. Nodes in the same environment share a private network, and all 32 ranks joined one process group across it and stayed there for the whole session.
The Ubuntu 24.04 R570 CUDA 12.8 with Docker image ships the driver and the container runtime already matched to the engine image, so the deployment goes from
ssh straight to docker run with no driver work at all.Spot VMs put the 32-GPU cluster at $64.00 per hour, and billing runs while the machines exist and stops when you delete them. An evaluation run is measured in tens of dollars, not thousands.
When the Marlin path stops being fast enough, NVIDIA H200 SXM at 141 GB per card and NVIDIA Blackwell reservations take the same launch command onto hardware with native FP4 kernels.

FAQs
What hardware do you need to run Kimi K3?
The checkpoint is 1,560.94 GB across 96 shards and every expert has to stay resident, so the constraint is total GPU memory rather than compute. The official vLLM recipe asks for at least one 8x NVIDIA B300 node. This guide serves it on 32x NVIDIA H100 80GB instead, across four Hyperstack nodes.
What is the maximum tensor-parallel size for Kimi K3?
Thirty-two. Tensor parallelism has to divide both the 96 attention heads and the 7168 hidden size, and their greatest common divisor is 32. Adding a fifth node therefore cannot lower the weights each GPU carries.
Why does the Kimi K3 endpoint always return reasoning_content?
Kimi K3 always thinks: it accepts an effort of low, high or max, and nothing turns thinking off. Launching with --reasoning-parser kimi_k3 puts that thinking in its own field, and you have to pass it back on the next turn or later replies become unstable.
How fast is Kimi K3 on 32x NVIDIA H100?
We measured 5.8 tokens per second single stream and 14.0 aggregate at four-way concurrency, on the Hopper Marlin path without speculative decoding. For contrast, the vLLM launch blog reports 111 per user on TP 8 at batch size 1, measured on NVIDIA GB300 NVL72.
How much does it cost to run Kimi K3 on Hyperstack?
Four 8x NVIDIA H100 Spot nodes are $2.00 per GPU per hour, so $64.00 per hour for the 32-GPU cluster. A clean run reaches a live endpoint in about 52 minutes, or roughly $55. Delete the machines afterwards, because the ephemeral disk holding the weights goes with them.
Subscribe to Hyperstack!
Enter your email to get updates to your inbox every week