


.png)
TABLE OF CONTENTS
NVIDIA H100 SXM GPUs On-Demand
Key Takeaways
- Qwen3.8 Max is 2.4T parameters with 95B active, ten of 512 experts plus one shared per token, and a 2.50 TB FP8 checkpoint across 213 shards.
- Tensor parallelism must divide the 64 attention heads, so six and seven node clusters hold the weights comfortably and still cannot be configured at all.
- Three of every four layers are Gated DeltaNet, so the recurrent state pool rather than the key-value cache caps concurrency, at 541 requests.
- Thinking cannot be turned off and reasoning shares the max_tokens budget, so a 6,144 token allowance returned 6,144 reasoning tokens and no answer at all.
- SGLang served it five minutes and 42 seconds after launch on all 64 NVIDIA H100 GPUs, at the full 262,144 token context.
Qwen3.8 Max is a 2.4 trillion parameter mixture-of-experts model from the Qwen team, and 95 billion of those parameters are awake for any one token. Alibaba put the hosted version in front of developers on 3 August 2026 and published the weights shortly afterwards, which is the first time a Qwen Max class model has been released for anyone to run on their own hardware. The FP8 checkpoint is 2.50 TB across 213 safetensors shards, so a Qwen3.8 Max deployment is a multi-node exercise before it is anything else.
This guide deploys it on Hyperstack across eight nodes of eight NVIDIA H100 80GB PCIe GPUs: eight virtual machines, 64 GPUs in total, running SGLang with tensor parallel 16 by pipeline parallel 4. Every figure below comes from one session on 12 August 2026 that pulled 2.50 TB of weights, reached a live OpenAI-compatible endpoint in under six minutes of engine start-up, and then answered chat, reasoning, tool-calling and concurrency workloads with zero failed requests across the sweep.
There is one thing worth settling before the hardware. The hosted Qwen3.8 Max API does not publish an activated parameter count, which leaves anyone modelling cost to guess at the compute behind a token. The open checkpoint states it in config.json: 95 billion active, ten routed experts of 512 plus one shared expert, 92 layers. That is what makes a Qwen3.8 Max deployment something you can size and price rather than estimate. If you have followed our Kimi K3 multi-node deployment, this is the same class of exercise with a different bottleneck, and the reasons are arithmetic rather than memory.
Inside Qwen3.8 Max: 2.4 Trillion Parameters, 95 Billion Awake
Qwen3.8 Max is a sparse model with a hybrid attention stack. Both halves of that sentence change how you deploy it. Take them one at a time before booking any hardware.
The Qwen3.8 Max FP8 checkpoint
The numbers that decide the cluster, taken from the published model card and the config.json inside the FP8 repository.
Sources: the Qwen3.8-2.4T-A95B-FP8 and the Qwen3.8-2.4T-A95B model cards. The licence on both repositories is named qwen3.8-max, which is the clearest signal that the open weights and the hosted flagship are the same model.
Sparsity Is What Makes 2.4 Trillion Parameters Servable
Every parameter has to be resident in GPU memory, because the router picks its experts per token and per layer, and there is no useful way to predict which ones. What sparsity buys is compute rather than capacity. The forward pass touches 95 billion parameters, so the cluster is sized by the weight of the model and the speed is set by a far smaller number.
What one token wakes up
The router selects ten of 512 experts in each layer, and one shared expert always runs alongside them.
Drawn from the layer configuration in the FP8 config.json: num_experts 512, num_experts_per_tok 10, plus a shared expert of intermediate size 2,048.
Resident against active
The full model has to fit. Only a small slice of it does the work on any given token.
Computed from the published parameter counts: 95 billion of 2,400 billion is 3.96 per cent, and eleven experts of 512 is 2.15 per cent.
The Hybrid Attention Stack Sets the Concurrency Limit
The 92 layers are not uniform. Three out of every four use Gated DeltaNet, a linear attention layer that carries a fixed-size recurrent state per sequence. The fourth is gated full attention with a conventional key-value cache. The configuration expresses this as full_attention_interval: 4, which gives 69 linear layers and 23 full attention layers.
One block, repeated 23 times
Three Gated DeltaNet layers, then one gated full attention layer, all the way to 92.
Layer types read directly from the layer_types array in config.json: 69 entries of linear_attention and 23 of full_attention.
The practical consequence arrives at serving time. A conventional transformer runs out of concurrency when the key-value cache fills, so the limit moves with context length. Here the recurrent state is a fixed cost per sequence regardless of how long that sequence becomes, and it is the larger of the two pools. When the engine reported its capacity, the ceiling on concurrent requests came from the recurrent state pool rather than from the key-value cache, and that shapes the whole throughput picture further down.
What the Published Scores Say
Qwen positions this release around long-horizon agentic work, coding and research rather than raw single-turn question answering, and the published headline scores follow that emphasis.
Qwen3.8 Max, published benchmark scores
Three results quoted on the model card, spanning research work, terminal use and software engineering. Higher is better on each.
Scores as published on the Qwen3.8-2.4T-A95B model card, quoted for context on what the model is aimed at rather than reproduced here.
Two repositories, one model. The BF16 checkpoint is roughly 4.45 TiB and the FP8 checkpoint is 2.27 TiB, which the vLLM recipe reports as needing three to six nodes and two to four nodes respectively. This deployment uses FP8, and the quantisation is native to the checkpoint rather than applied at load time.
The Qwen3.8 Max Deployment Architecture: Why 64 NVIDIA H100 GPUs
Sizing a cluster for a 2.50 TB checkpoint looks like a division problem and is not one. Memory rules out the small clusters, and then a second constraint rules out two more that memory was perfectly happy with. Getting to the right answer takes both filters, in that order.
The checkpoint against the cluster
Eight nodes of eight NVIDIA H100 80GB cards give 5,120 GB of GPU memory. The weights take a little under half of it.
Checkpoint size from the Qwen3.8-2.4T-A95B-FP8 repository: 213 shards totalling 2.50 TB.
The First Filter Is Memory, and It Is the Forgiving One
Weights are only part of what a GPU has to hold. The recurrent state pool, the key-value cache and the captured CUDA graphs all come out of the same 80 GB, and whatever is left is what serves the running batch. We sized this deployment against a floor of roughly 25 GB free per GPU after weights, which turns the question from a theoretical lower bound into a usable one.
Four nodes fail this outright. The weights alone would need 78.1 GB of an 80 GB card, which leaves nothing for anything else. Five nodes clear the weights and then fall under the free-memory floor. Six and seven nodes pass comfortably.
The Second Filter Is Divisibility, and It Is the Strict One
A parallel placement is only legal if the numbers divide. The pipeline degree has to divide the layer count evenly, and the tensor degree has to divide the attention head count and the expert count. Applying that to six and seven nodes removes both, even though both fit the weights with room to spare.
Memory headroom is not a feasibility test
Two cluster sizes hold the weights comfortably and still cannot be configured at all.
Independently re-derived by the model itself during the tool-calling run further down, which rejected six and seven nodes for the same reason.
The arithmetic behind that is short enough to check by hand. Qwen3.8 Max has 92 layers, and 92 factorises as 2 squared times 23, so a pipeline degree has to be one of 1, 2, 4, 23, 46 or 92. It also has to divide the GPU count. On 48 GPUs that leaves pipeline degrees of 1, 2 and 4, giving tensor degrees of 48, 24 and 12. None of those divides 64 query heads. On 56 GPUs the tensor degrees are 56, 28 and 14, and again none divides 64. Six and seven node clusters are not tight, they are impossible.
Every count that has to divide, at tensor parallel 16
The chosen placement splits each of these cleanly, which is what makes it legal.
| What is being split | Value in the config | Divided by 16 | Result |
|---|---|---|---|
| Query heads | 64 | 64 / 16 | 4 per GPU |
| Gated DeltaNet key heads | 16 | 16 / 16 | 1 per GPU |
| Gated DeltaNet value heads | 128 | 128 / 16 | 8 per GPU |
| Routed experts | 512 | 512 / 16 | 32 per GPU |
| Hidden size | 8,192 | 8,192 / 16 | 512 per GPU |
| Layers, across pipeline stages | 92 | 92 / 4 | 23 per stage |
Values read from config.json in the FP8 repository. Key-value heads are 4, which is smaller than the tensor degree, so the engine replicates them across the group. That is ordinary behaviour for grouped-query attention at high tensor parallelism, and it means the key-value cache does not shrink as the tensor degree rises.
Why Pipeline Parallel 4 and Tensor Parallel 16
Three placements are legal on 64 GPUs: tensor 64 by pipeline 1, tensor 32 by pipeline 2, and tensor 16 by pipeline 4. The choice between them is about where the traffic goes.
A tensor-parallel group communicates on every layer, so its members want to be as close together as possible. At tensor 64 the group spans all eight machines, and every collective in every layer crosses the network across 64 ranks. At tensor 16 the group spans two machines, and the four pipeline stages exchange activations only at the three stage boundaries. Twenty-three layers per stage divides evenly. The SGLang cookbook lists a verified four-node NVIDIA H200 placement for this same FP8 checkpoint, which is the same weights on cards large enough to need half as many GPUs. Our guide to tensor and pipeline parallelism covers the general trade-off between the two axes if you want the background.
Tensor parallel 16 by pipeline parallel 4, over eight nodes
Each pipeline stage owns 23 layers and runs across two machines. Every GPU in the cluster holds a slice of every expert it is responsible for.
The exact shape launched in this deployment: --tp-size 16 --pp-size 4 --nnodes 8.
Pipeline parallelism turns off speculative decoding. The config declares mtp_num_hidden_layers: 1, so a multi-token prediction head exists in the checkpoint. With a pipeline degree above one the engine does not use it, and the startup log states plainly that pipeline parallelism is incompatible with the overlap schedule. On hardware where the whole model fits in one tensor group, that head becomes available again.
What the Fabric Decides About Your Launch Flags
The launch command carries four settings that exist because of how the GPUs are wired, not because of anything about Qwen3.8 Max. Reading the topology first makes all four obvious.
How the cards inside one node are joined
NVLink bridges pair the cards. Every other path between them runs through the PCIe host bridge.
The NVIDIA H100 80GB PCIe flavour carries three NVLink bridges per card at 600 GB/s bidirectional, which is what nvidia-smi reports as NV12 between paired devices.
A tensor-parallel group of 16 covers eight cards on one machine and eight on another, so the group is a multi-node group by definition. Two single-node optimisations then switch themselves off, and the engine says so during startup.
Neither line calls for action. Both are the engine selecting the portable path because the fast path is only correct within one machine. What does call for action is telling the collectives which interface to use, because a multi-homed node will otherwise pick the wrong one and the rendezvous will not complete.
The four fabric settings, and why each one is there
These belong in the container environment rather than in the server arguments.
| Setting | Value used | Why |
|---|---|---|
NCCL_SOCKET_IFNAME |
ens6 |
Names the interface holding the private 10.x address, so collectives use the private network rather than the public one. |
GLOO_SOCKET_IFNAME |
ens6 |
The rendezvous itself runs over Gloo and needs the same instruction separately. |
NCCL_IB_DISABLE |
1 |
This flavour communicates between nodes over Ethernet, so InfiniBand discovery is skipped rather than attempted and timed out. |
SGLANG_HOST_IP |
the private address of this node | Each rank advertises the address its peers can reach, which is the private one and never the floating IP. |
The private network is reachable only inside your Hyperstack environment, which is why the firewall rule in Step 2 can open the whole 10.0.0.0/8 range to itself without exposing anything.
Tensor parallel 16 is a consequence, not a preference. The group is 16 wide because 80 GB cards need 64 of them to hold 2.50 TB, and 64 GPUs admit only three legal splits. Card size is what moves this number, and the cost section prices that out.
How to Deploy Qwen3.8 Max on Hyperstack, Step by Step
Nine steps take a Qwen3.8 Max deployment from an empty account to an endpoint answering requests. Everything up to Step 5 is ordinary virtual machine work repeated eight times. The launch itself is Steps 6 and 7, and Step 7 is where the flags specific to this model appear.
One environment, one flavour, one image, one SSH key.
Two locked to your own address, one open inside the private range.
The root disk holds 96 GB and the checkpoint is 2.50 TB.
213 shards on all eight nodes, in parallel.
Twenty seconds of checks protect a 64-rank rendezvous.
Rank, private address, head address, interface.
The same command everywhere, with the rank changing.
Five memory checkpoints tell you it is going well.
The endpoint speaks the OpenAI chat completions API.
Step 1: Create Eight Virtual Machines
From the Hyperstack dashboard, open the virtual machines page and start a new deployment. The getting started guide covers the account setup if this is a first deployment.
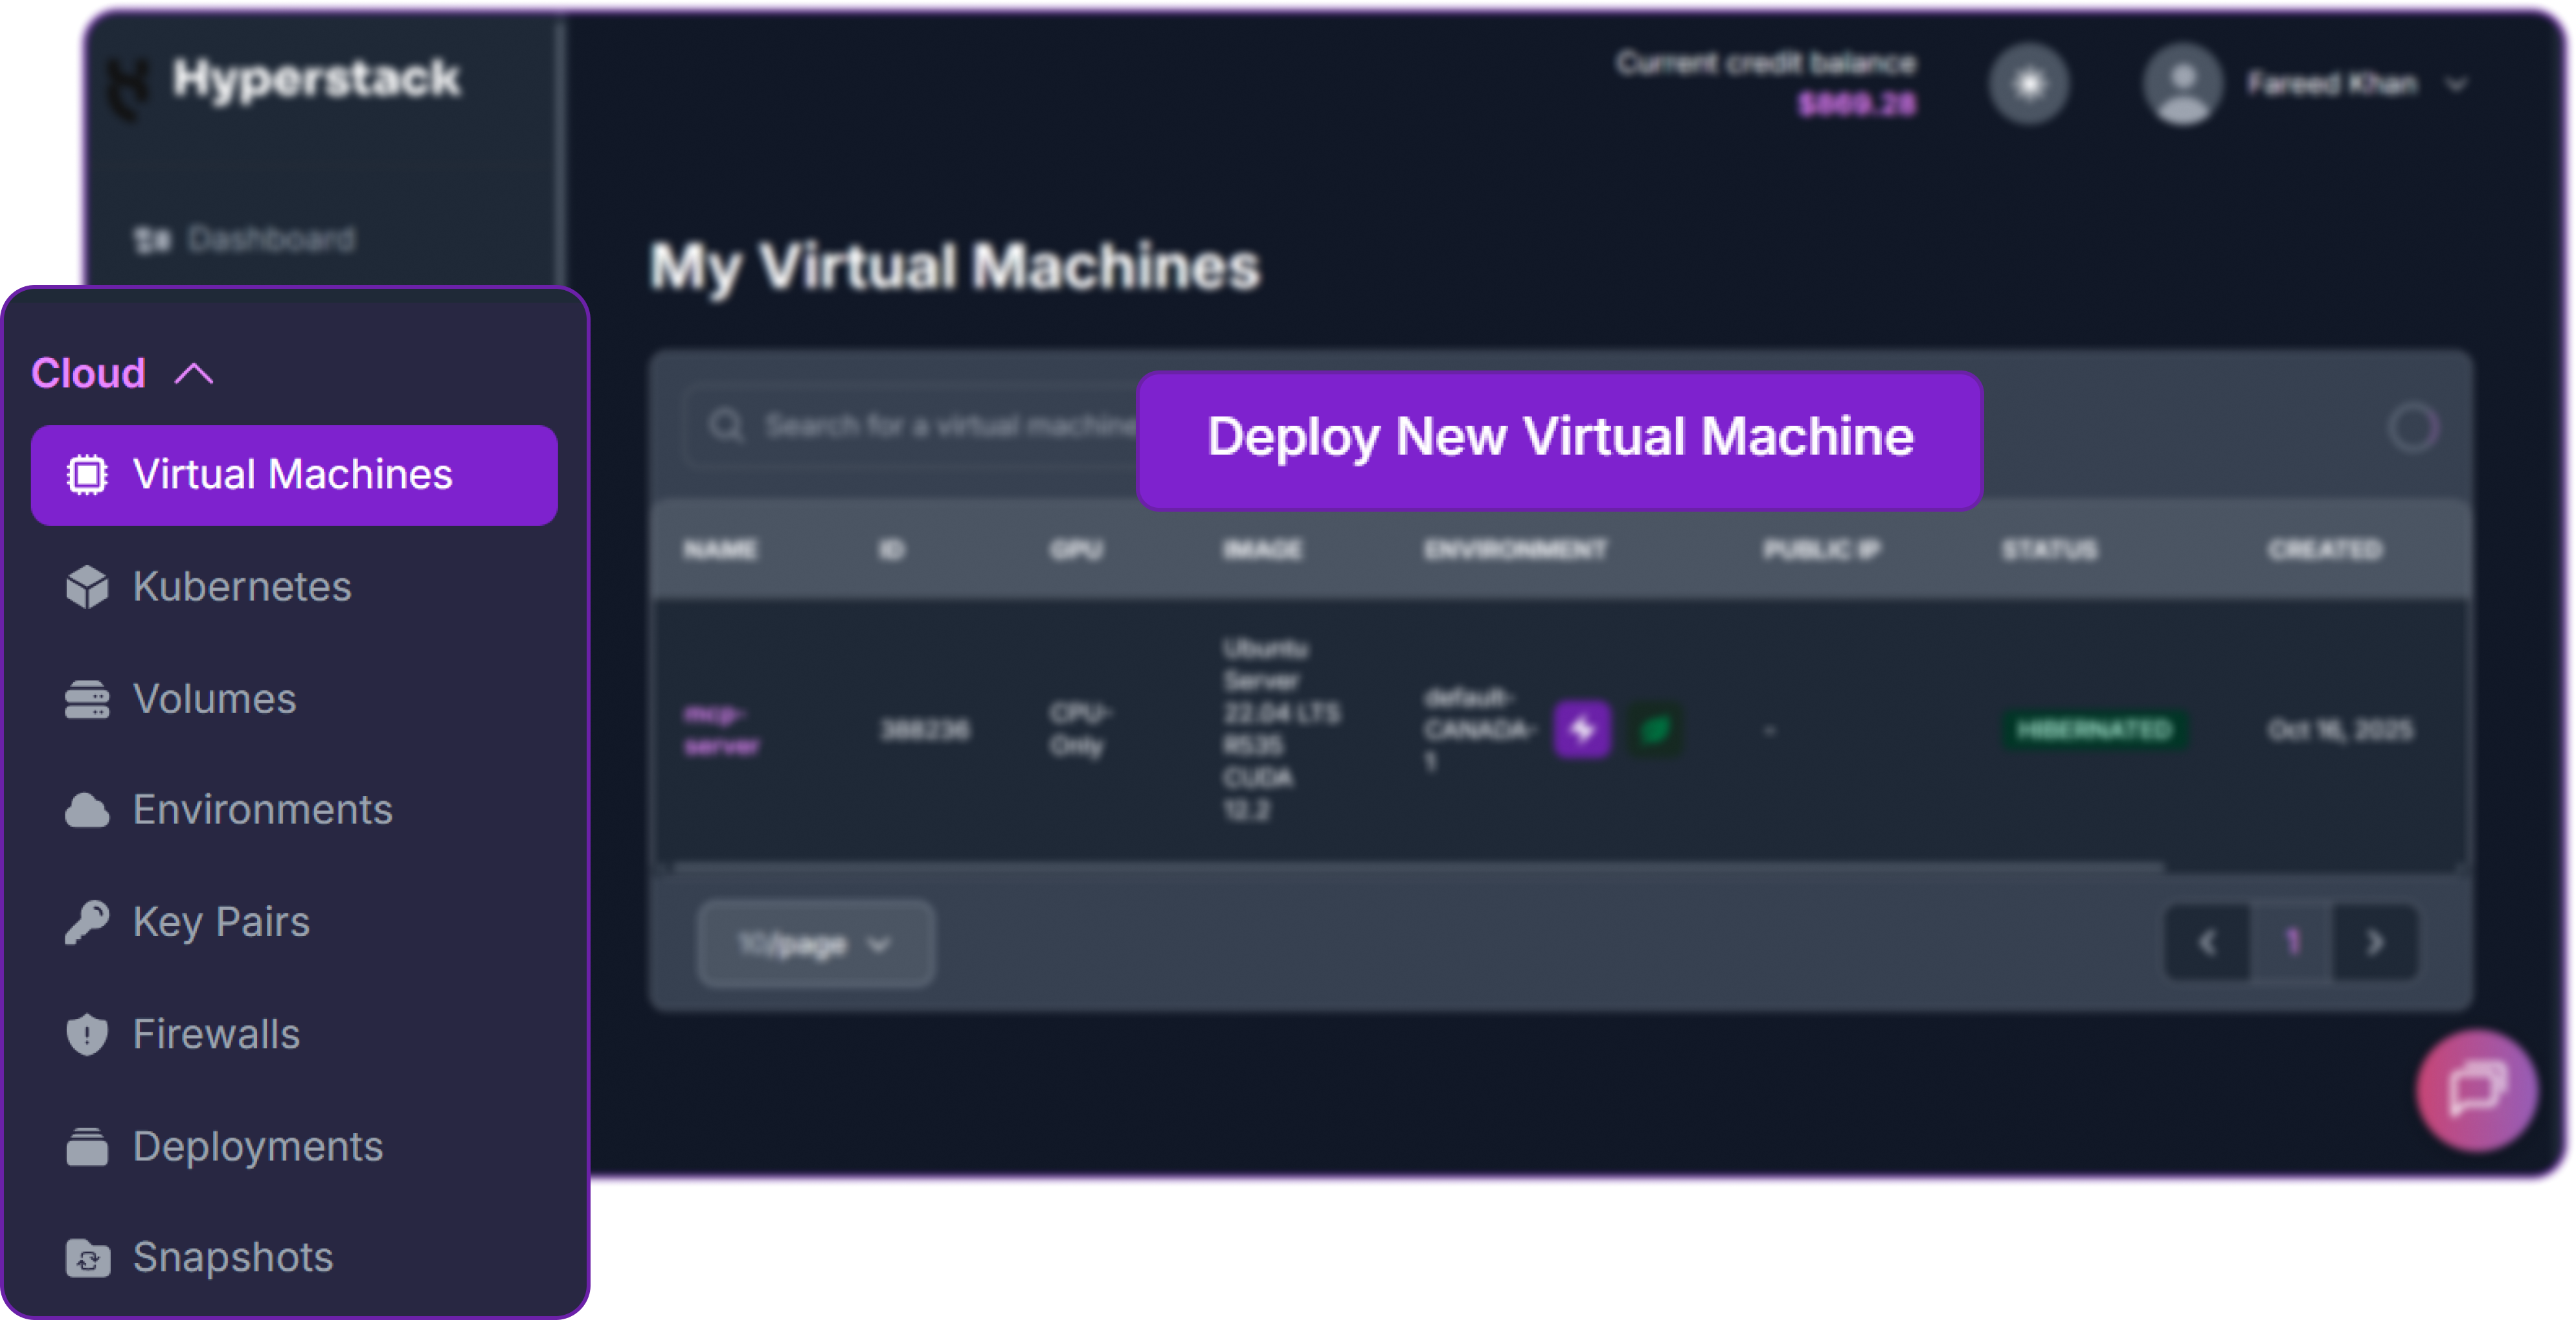
Start from the virtual machines page and select deploy a new virtual machine.
Four choices matter, and one of them matters more than the rest.
What to select, and why
The environment field is the one that quietly decides whether this cluster can form at all.
| Field | Selection | Why it matters |
|---|---|---|
| Environment | One environment for all eight | Nodes share a private network only within an environment. Split them and the ranks cannot reach each other. |
| Flavour | 8x NVIDIA H100 80GB PCIe | Eight nodes of eight cards give the 64 GPUs the checkpoint needs. Browse the full list in the flavour reference. |
| Image | Ubuntu Server 24.04 LTS R570 CUDA 12.8 with Docker | Driver, CUDA and container runtime arrive matched to the serving image, so there is no driver work at all. |
| SSH key | A key already imported to the account | Import it first from the key pairs page. A machine created without one cannot be reached. |
| Floating IP | Enabled | You need to reach each node once to set it up, and the head node again to serve traffic. |
Name the machines predictably, for example q38-0 through q38-7. Rank 0 becomes the head node and the endpoint you eventually call.
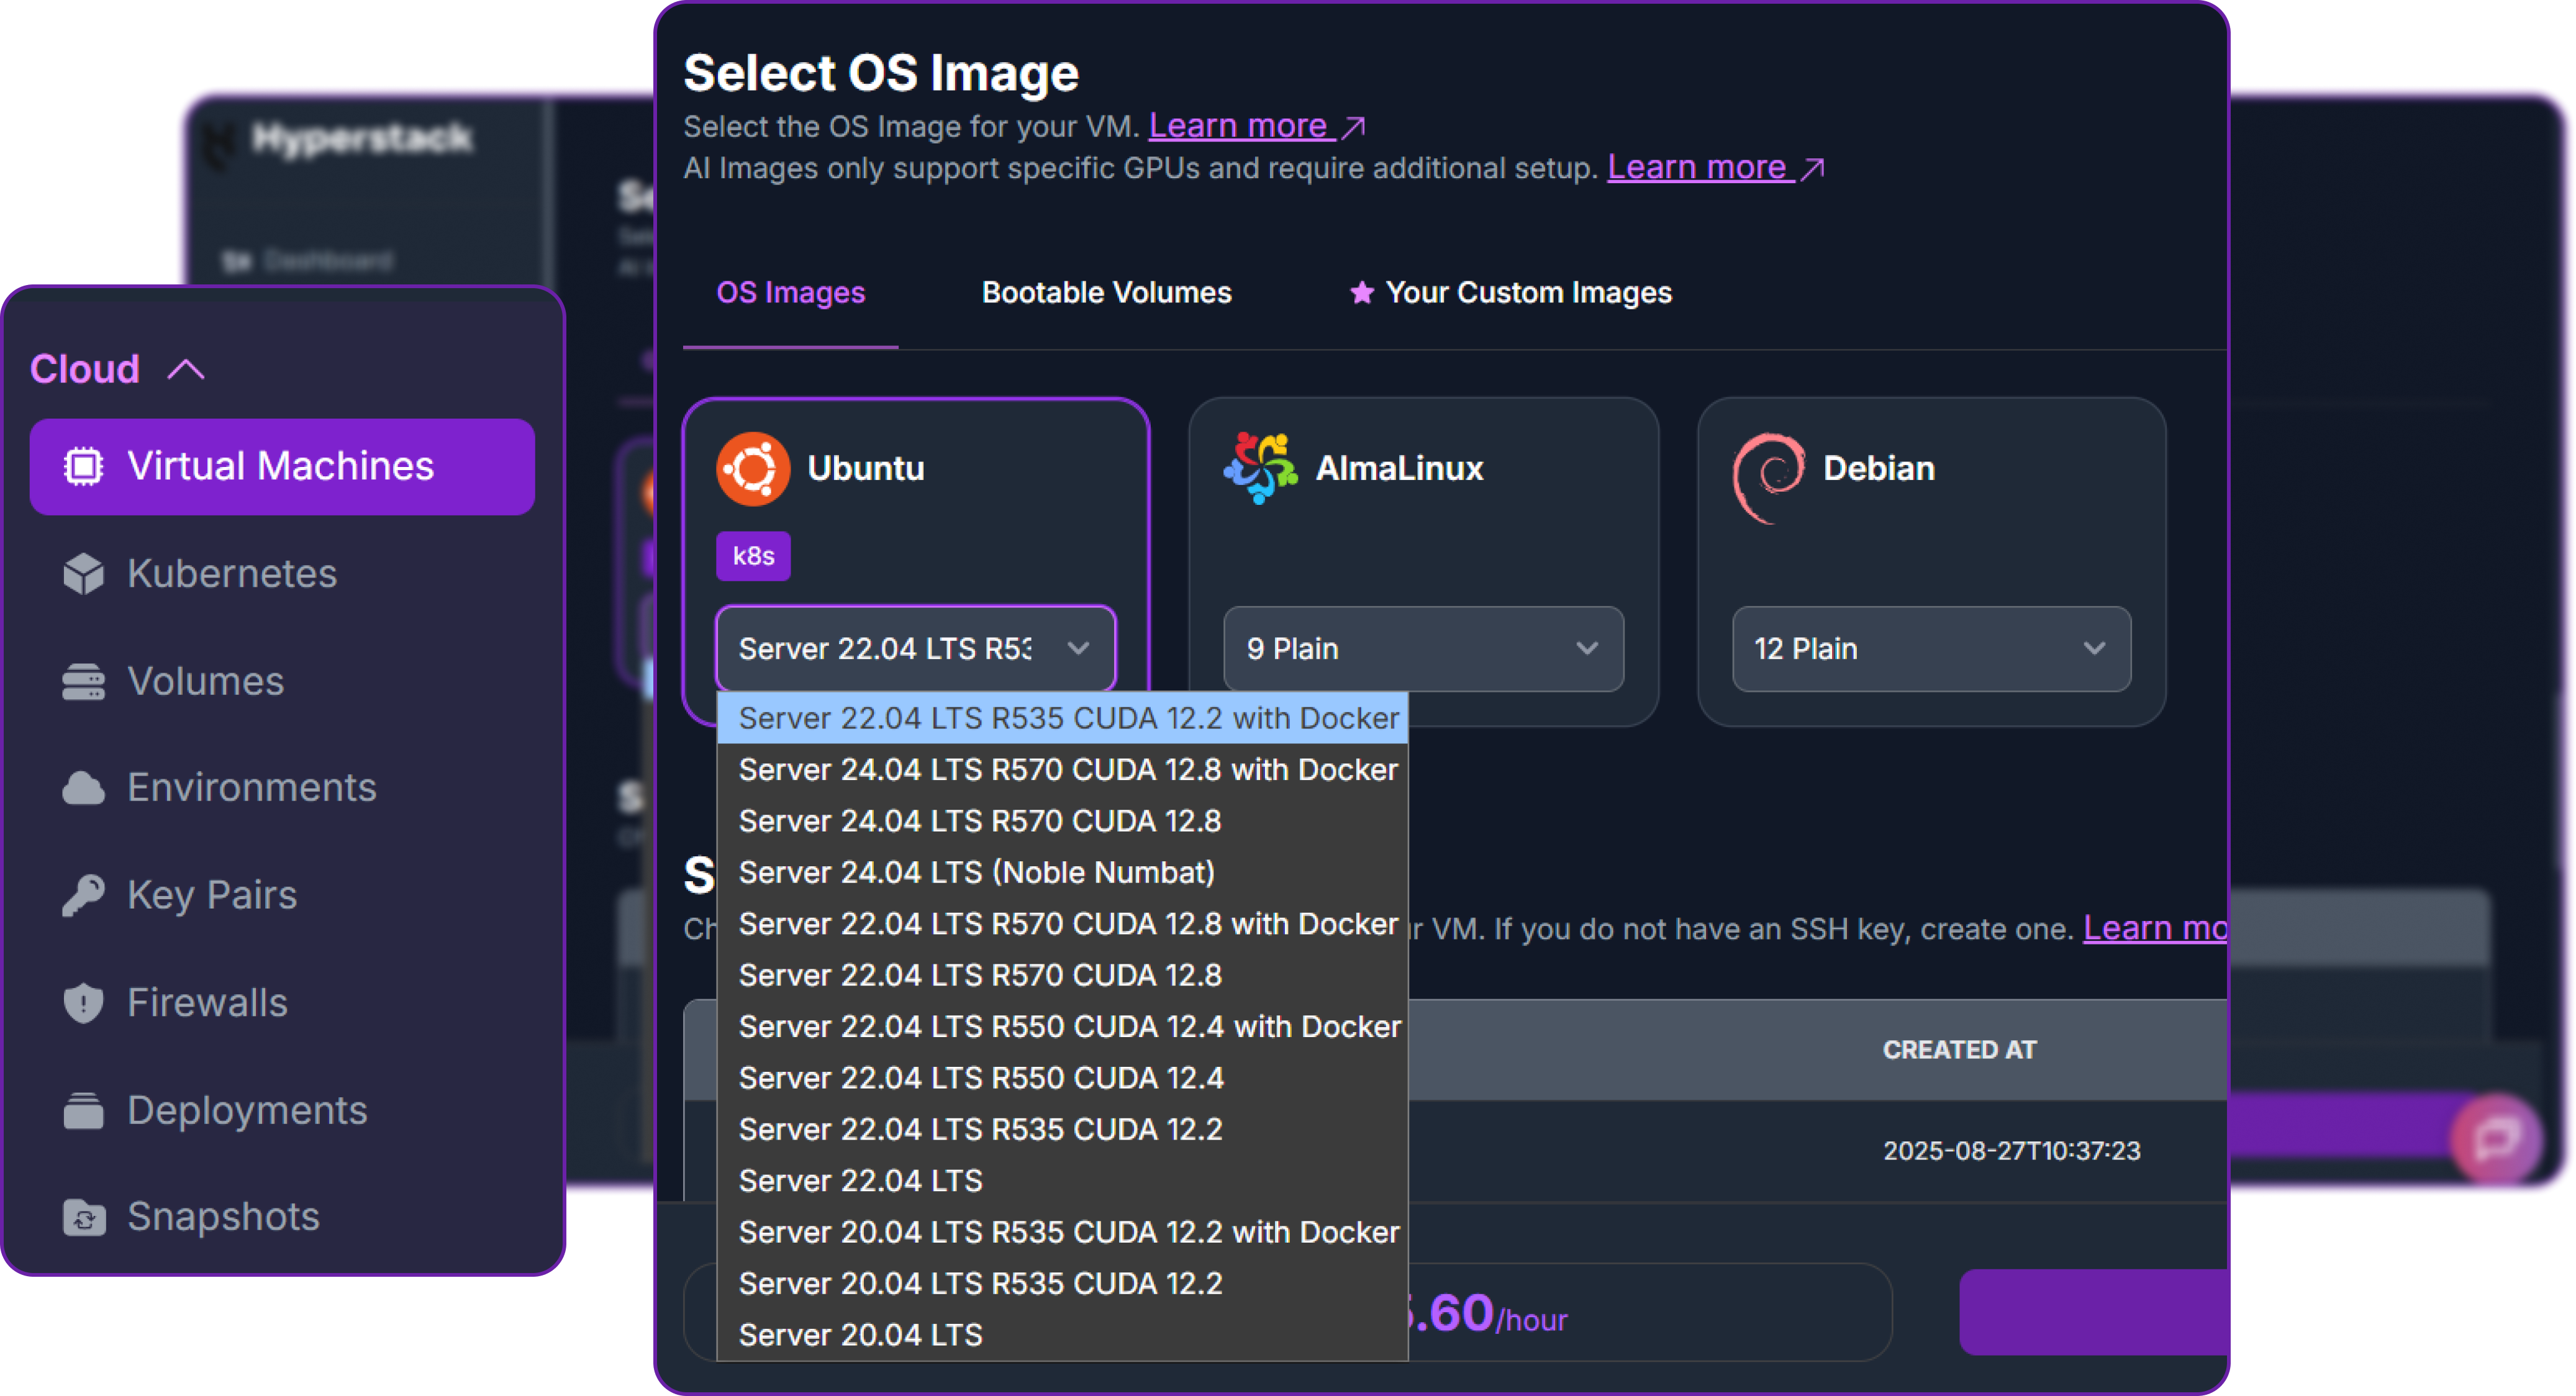
The image picker. Choosing the CUDA and Docker variant removes every driver step from this deployment.
Spot pricing changes the arithmetic on a cluster this size. An eight-node deployment costs eight times whatever one node costs. Spot virtual machines put NVIDIA H100 80GB PCIe at $2.00 per GPU hour on the published pricing, which is $16.00 per node and $128.00 per hour for this cluster, billed by the minute.
Step 2: Open the Three Ports That Matter
A multi-node deployment needs the nodes to talk to each other freely and needs you to talk to exactly one of them. Attach these firewall rules to every machine.
Firewall rules for the cluster
Two rules scoped to your own address, and one scoped to the private range.
| Direction | Protocol and port | Source | Purpose |
|---|---|---|---|
| Ingress | TCP 22 | your address /32 | SSH for setup and launch |
| Ingress | TCP 30000 | your address /32 | The inference endpoint, on the head node |
| Ingress | TCP 1 to 65535 | 10.0.0.0/8 | Rendezvous and collectives between ranks |
The third rule looks broad and is not: 10.0.0.0/8 is private address space reachable only from inside your environment. The rendezvous port, the collective ports and the pipeline transfers all live in there.
Step 3: Point the Model Cache at the Ephemeral Disk
Once the machines are active, connect to each one and take stock. The root disk is 96 GB, which is not where 2.50 TB of weights is going. This flavour ships an ephemeral NVMe disk mounted at /ephemeral, and that is the destination.
Every card reports 81,559 MiB and the private interface is ens6, holding a 10.x address. The third command is the one that decides where the weights go: the root disk is 96 GB, so /ephemeral has to take the 2.50 TB checkpoint. Confirm it has the room before starting the download.
Step 4: Pull the Serving Image and the Weights
The container image and the checkpoint can be fetched at the same time, and on eight nodes both should be started in the background so a dropped SSH session does not take the download with it. The image comes from the SGLang project and carries the kernels this model needs.
The weights need a Hugging Face token with access to the Qwen3.8-2.4T-A95B-FP8 repository. Create one from your account settings and keep it out of your shell history.
Every node downloads the whole checkpoint. There is no sharding of the download by rank. Each node reads the shards it needs at load time and ignores the rest, so all eight machines pull 2.50 TB and the cluster moves 20 TB in total. This is the longest step in the deployment by a wide margin, and it is the one to start first.
Step 5: Confirm Every Node Before You Commit to a Launch
A 64-rank job starts by having all 64 ranks meet each other. Every rank waits for the others, so the cluster is only as ready as its least ready node. Checking takes about twenty seconds per machine, and it belongs immediately before the launch rather than earlier in the session.
The shard count is the check that pays for itself most often, because a download that stopped short looks completely normal until the engine reaches the missing file twenty minutes into loading. Three more checks round it out.
What each check is protecting
Four cheap reads, each standing in front of a failure that would otherwise appear much later and cost much more.
| Check | Expected | What it prevents |
|---|---|---|
nvidia-smi -L returns within a timeout |
8 GPUs | A node that answers slowly holds up the whole rendezvous. |
ecc.mode.current |
Enabled on all cards | Error correction is what turns a marginal memory cell into a logged event rather than a quietly wrong number inside 2.50 TB of weights. |
| A live 10.x interface | One name, for example ens6 |
NCCL_SOCKET_IFNAME has to name an interface that exists on that machine. |
| Shard count | 213, with none incomplete | A missing shard fails the load long after the cluster has committed to it. |
Treat any node that does not pass as a node to rebuild rather than a node to try anyway. Nothing about a 64-rank launch improves by starting it with seven good machines.
Step 6: Set the Launch Environment
Four values differ per node. Everything else in the launch is identical across the cluster, which is what makes this straightforward to script.
The head address is the private address of rank 0 and is the same on every node. The rank is the one value that has to be unique across the cluster, so set it from the machine name rather than by hand if you are scripting this.
Step 7: Launch All Eight Ranks
The arguments split into three groups: the topology, the backends the hardware calls for, and the parsers that shape the responses. Building them into one variable keeps the launch readable and keeps every node running the same string.
The flags that are specific to Qwen3.8 Max
Everything else in that command is topology. These are the ones that exist because of what this model is.
| Flag | Why it is set |
|---|---|
--linear-attn-prefill-backend flashinfer--linear-attn-decode-backend flashinfer |
The Gated DeltaNet layers default to a Triton path on this GPU generation. NVIDIA H100 and NVIDIA H200 share compute capability 9.0, so a kernel choice verified on one carries to the other, and pinning both halves to FlashInfer is what this deployment ran. |
--mamba-full-memory-ratio 0.95 |
Sets how much of the free memory becomes recurrent state pool. This is the value behind every figure here, and a starting point rather than a figure tuned for this hardware. |
--mamba-ssm-dtype bfloat16 |
Halves the size of each state slot against float32, which directly raises how many requests can run at once. |
--mamba-radix-cache-strategy extra_buffer |
Required to keep --page-size 64. Without it the recurrent cache requires a page size of 1, at a cost in paging efficiency. |
--reasoning-parser qwen3 |
Returns the chain of thought in its own response field instead of inline inside the answer. |
--tool-call-parser qwen3_coder |
Turns the native tool syntax of this model into OpenAI-shaped tool_calls. |
Flags are verified against a specific build. Setting the recurrent cache strategy explicitly rather than leaning on a default is what keeps a launch working across an image update.
The container itself needs host networking so the ranks can reach each other on the private addresses, the checkpoint mounted from the ephemeral disk, and enough shared memory for the loader. Run this on all eight nodes.
Launch the head node first, then the rest together. Rank 0 owns the rendezvous address, so starting it a moment ahead of the others means every other rank finds it on the first attempt. The --dist-timeout 1800 setting gives the group thirty minutes to form, which is generous for 64 ranks and worth keeping while you are getting familiar with the Docker workflow on these machines.
Step 8: Watch the Start-up
The engine reports its memory at five points, and those five numbers are the clearest signal that a launch is going well. Follow the head node.
The ranks meet first. Twenty-six seconds for 64 processes to join one group is normal, and the two lines about collectives are the engine adapting to a group that spans machines rather than anything going wrong.
Free memory falling from 78.05 GB to 41.73 GB is the moment the deployment becomes real. That 36.32 GB per GPU is the FP8 checkpoint spread across 64 cards. Our first load took 5 minutes 38 seconds reading cold from disk. On a relaunch with the page cache still warm the first rank finished in 45 seconds and the last in 55, and it is the slowest rank that decides when the cluster moves on.
This is where the hybrid attention stack shows up in the accounting. The recurrent state pool takes 9.79 GB and the key-value cache takes 8.60 GB, and it is the recurrent pool that sets the ceiling on concurrent requests. The engine states the limit and the arithmetic behind it in one line: 2,164 state slots, four slots per request, so 541 requests can run at once.
Where the 78.05 GB on each GPU goes
Measured from the free-memory checkpoints the engine prints, so the segments are differences between real readings rather than an estimate.
Weights 36.32 GB, memory pools 18.95 GB, prefill graphs 4.02 GB, decode graphs 1.42 GB, leaving 17.34 GB free at steady state.
Capturing CUDA graphs is the longest phase of a warm start. The prefill capture walks 58 different token counts and the decode capture walks 52 batch sizes, and together they account for more than half the time between launching the container and answering a request.
The cold start, phase by phase
Total time from container start to a live endpoint was five minutes and 42 seconds on a warm page cache.
Weight load shown at the warm figure of 55.0 seconds. Reading the shards cold from the ephemeral disk the first time took 5 minutes 38 seconds, which puts a fully cold start at roughly ten minutes.
The same start-up as a timeline
Eight moments worth recognising in the log, with the three that confirm progress marked.
Timestamps from the head node log of this deployment.
Step 9: Send the First Request
The endpoint speaks the OpenAI chat completions API on port 30000 of the head node. No other rank needs to be reachable from outside the environment.
While that runs, the cluster looks like this. Roughly 63,400 MiB in use of the 81,559 MiB on each card, at low temperature, because a mixture-of-experts model at low concurrency waits on memory traffic rather than saturating the compute.
Where a request goes
One endpoint, four pipeline stages, and a tensor-parallel group of 16 inside each stage.
Only rank 0 needs the floating IP. The remaining seven nodes work entirely on the private network.
Qwen3.8 Max Inference: Reading What Comes Back
Qwen3.8 Max reasons before it answers, on every request. That single fact changes how a client has to be written, and it is the part of a Qwen3.8 Max implementation most likely to catch a team that has ported code from a model without chain of thought.
The Chain of Thought Arrives in Its Own Field
Because the server was launched with --reasoning-parser qwen3, the reasoning does not appear inline in the answer wrapped in tags. It comes back in message.reasoning_content, and the answer in message.content is clean. A client can log the reasoning, show it, or discard it, without parsing anything.
The usage block carries a reasoning_tokens field alongside completion_tokens, which is the number to watch. Reasoning is not billed separately in a self-hosted deployment, but it does consume the same budget as the answer.
Reasoning and the Answer Share One Token Budget
This is the behaviour to design around. max_tokens covers the reasoning and the answer together, not the answer alone. We sent the same code prompt at two budgets.
One budget, two outcomes
The same prompt, the same model, the same sampling settings. Only max_tokens changed.
finish_reason set to length. The second one carried an empty content field and 6,144 reasoning tokens.Captured from the two code prompts in this deployment. At 2,048 tokens the answer stopped in the middle of a function body; at 6,144 the content field came back empty.
At 6,144 the model spent the entire allowance thinking and emitted no answer tokens at all. A budget sized for a model without chain of thought does more than clip the tail here. It can return an empty response, or code that looks complete and is not.
Check finish_reason on every response. A value of length means the budget ran out, and on this model that can mean an answer that stops mid-token or no answer at all. Treat it as a retry signal with a larger budget or a lower reasoning effort, never as a completed response.
Reasoning Effort Is the Control Worth Wiring Up
The Qwen3.8-2.4T-A95B model card documents three reasoning levels, low, medium and xhigh, with xhigh as the default. Every measurement below was taken at the default, which is the most expensive setting and the right one to measure against. It is also the first lever to reach for when a workload does not need deep deliberation on every turn.
How much of each response was reasoning
Five prompts of rising difficulty. Each bar is one response at 100 per cent, split into thinking and answering, with its total completion tokens above it.
Taken from the usage block of each captured response. The rightmost bar is the 6,144 token budget that returned no answer at all.
The shape of that chart is the useful part. On a two-sentence factual question the model spent 105 tokens thinking and 65 answering. On a code task it spent 1,871 thinking and 177 answering. Reasoning grows with difficulty far faster than the answer does, so a fixed budget that suits simple traffic will fail on hard traffic rather than degrade on it.
Tool Calling Works End to End
The qwen3_coder parser turns the native tool syntax of this model into OpenAI-shaped tool_calls. We tested it with a loop that executes the tools and feeds each result back, because a broken parser still produces plausible-looking first-turn output.
The task was to size a cluster for this exact model using only tool results. It made four dependent calls in the right order, taking each argument from the previous result, across eight turns and 54.6 seconds.
The final answer then reproduced the non-obvious part without being prompted for it: six and seven node clusters fit the weights in memory and admit no legal placement, so they are infeasible. That is the same conclusion the architecture section reached, arrived at independently from the tool output.
It Gets the Arithmetic Right
Two of the prompts had ground truth we could check rather than eyeball. Asked for the annual cost of a 6.5 kW rack at $0.11 per kWh with cooling billed at 40 per cent of the power bill, it returned $6,263.40 for power, $2,505.36 for cooling and $8,768.76 in total, which matches an independent calculation exactly. Asked how 92 layers can be split evenly across pipeline stages, it returned the full set.
Throughput, and What Sets It
We swept concurrency from one request to 32 against the live endpoint, with a 256 token cap on each, and measured what came back.
Aggregate throughput against median latency
Aggregate output rises 7.5 times from one request to 32. Per-stream speed falls, which is the expected trade.
Every request in the sweep succeeded: 53 in total across the four levels, with no failures at any concurrency.
22.4 second median latency
32.3 second median latency
86.8 second median latency
95.3 second median latency
The Recurrent State Pool Is the Ceiling, Not the Context Length
On a conventional transformer, concurrency runs out when the key-value cache fills, so long prompts and many users compete for the same resource. Here the engine reported a limit of 541 concurrent requests set by the recurrent state pool, from 2,164 state slots at four slots per request. That limit does not move with prompt length, because a Gated DeltaNet layer carries the same fixed state whether the sequence is a thousand tokens or a hundred thousand.
Two flags move it. Raising --mamba-full-memory-ratio gives the pool more of the free memory, and --mamba-ssm-dtype bfloat16 halves the size of every slot against float32. Both are already set in the launch above.
Two Limits on These Figures
These numbers are a floor rather than a ceiling, for two reasons.
What is left on the table
Both are headroom that a production deployment can claim.
| What | Effect | What to do about it |
|---|---|---|
| The mixture-of-experts kernels are running an untuned configuration | The engine ships tuned configurations per model, GPU and tensor degree, and there is none published for 512 experts at tensor parallel 16 on NVIDIA H100. It says so during start-up. | Tune the kernel configuration for this shape, or move to a placement that has a published configuration. |
| No speculative decoding | The checkpoint contains a multi-token prediction head, and a pipeline degree above one disables it. Single-token decoding is the slow path for a sparse model. | Fewer, larger GPUs allow pipeline degree 1, which brings the head back into play. |
The start-up log names the missing kernel configuration explicitly, which is a useful thing to grep for on any new placement.
The route to more speed is fewer, larger cards. Every constraint here traces back to fitting 2.50 TB onto 80 GB cards. NVIDIA H200 SXM at 141 GB per card halves the GPU count, which narrows the tensor group and keeps far more traffic inside a machine. NVIDIA Blackwell with a 4-bit checkpoint brings the whole model into a single node, which removes the pipeline dimension and the constraint that comes with it.
Qwen3.8 Max Deployment Cost
A Qwen3.8 Max deployment cost is easy to reason about once the node count is settled, because the cluster bills as eight identical machines by the minute. The rate is the same whether the GPUs are loading weights, capturing graphs or serving traffic, so the only open question is how long each phase lasts.
What it costs to hold 2.50 TB of weights for an hour
This deployment is the first row. The others carry the same checkpoint on different hardware.
| Configuration | GPUs | Per GPU hour | Per hour |
|---|---|---|---|
| NVIDIA H100 80GB PCIe on Spot, used here | 64 | $2.00 | $128.00 |
| NVIDIA H100 SXM, on demand | 64 | $3.20 | $204.80 |
| NVIDIA H100 SXM, reserved from | 64 | $2.72 | $174.08 |
| NVIDIA H200 SXM, on demand | 32 | $3.99 | $127.68 |
Per GPU rates from the Hyperstack GPU pricing page, multiplied by the GPU count each configuration needs. The NVIDIA H200 SXM row is 32 GPUs rather than 64, because 141 GB cards hold 2.50 TB in half as many, and that puts an hour of it within 32 cents of the Spot cluster used here.
What Each Phase Cost in This Deployment
These are the phases we timed, priced at the Spot cluster rate of $128.00 per hour, which is $2.13 a minute. Everything here is measured rather than modelled.
Measured phases and their cost
A deployment spends most of its money before it answers a single request, and then the bill settles into a flat hourly rate.
| Phase | Duration | Cost at $2.13 per minute | How often you pay it |
|---|---|---|---|
| Engine start, warm page cache | 5 min 42 s | $12.14 | Every launch after the first |
| Engine start, cold from disk | about 10 min | about $21.30 | The first launch of a session |
| Chat and reasoning prompts, four of them | 5 min 50 s | $12.43 | Workload dependent |
| Tool-calling scenarios, two of them | 3 min 9 s | $6.70 | Workload dependent |
| Concurrency sweep, 1 to 32 | 3 min 58 s | $8.46 | Workload dependent |
| Steady-state serving | per hour | $128.00 | Continuously, while running |
Durations from the captured latencies of each run. The 2.50 TB download runs before any of this and is the longest single phase in the deployment, so start it as soon as the machines are active and do the firewall work while it runs.
The Three Levers That Move the Bill
Only one of these is a tuning exercise. The other two are decisions taken before the cluster exists.
What to change, in order of effect
Node count sets the floor, the pricing model scales it, and start-up time is what you pay repeatedly while iterating.
| Lever | Effect |
|---|---|
| Card size | The largest lever, and the table above prices it: half the GPUs for the same money, with 62.9 GB free per GPU rather than 40.9 GB. A 4-bit NVIDIA Blackwell checkpoint at 1.32 TiB goes further again and fits one node. |
| Pricing model | Spot is the cheapest route onto NVIDIA H100 80GB PCIe at $2.00 per GPU hour. On the SXM flavours the lever is a reservation instead, which starts at $2.72 per GPU hour against $3.20 on demand. |
| Start-up time | Capturing CUDA graphs is 221.6 seconds of every launch. That cost is fixed per launch rather than per request, so it matters while you are iterating and disappears once the endpoint is long-lived. |
Billing is per minute of runtime rather than by the hour, so a short experiment is charged as a short experiment.
Why self-host a model that is also available as an API. The open checkpoint gives you the full 262,144 token context with no per-token metering, the sampling and reasoning controls in your own hands, weights that stay inside your own environment, and an activated parameter count you can read. Those are the reasons a Qwen3.8 Max deployment earns its cluster, rather than a per-token comparison.
Why Deploy Qwen3.8 Max on Hyperstack?
Hyperstack is a cloud platform built for AI and machine learning workloads. Here is what a 64-GPU deployment needs from a provider, and how that maps onto the platform:
Eight nodes of NVIDIA H100 80GB PCIe carry 39.1 GB per GPU. One environment gives them a private network, and all 64 ranks met in 26.6 seconds.
A 96 GB root disk cannot hold 213 shards. The ephemeral NVMe disk at
/ephemeral took the whole 2.50 TB on every node.The Ubuntu 24.04 R570 CUDA 12.8 with Docker image already matches the serving image, so every node goes from
ssh to docker run with no driver work.Spot virtual machines put 64 NVIDIA H100 80GB PCIe GPUs at $128.00 per hour, billed by the minute.
Firewall rules attach per machine, so SSH and the endpoint stay locked to your own address while 10.0.0.0/8 opens only inside the environment.
NVIDIA H200 SXM at 141 GB halves the GPU count, and NVIDIA Blackwell reservations take a 4-bit checkpoint into one node.

FAQs
What hardware do you need to deploy Qwen3.8 Max?
The FP8 checkpoint is 2.50 TB, which is 39.1 GB per GPU across 64 cards. We ran it on eight Hyperstack nodes of 8x NVIDIA H100 80GB PCIe, leaving 17.34 GB free per GPU once the caches and CUDA graphs were resident.
How much does a Qwen3.8 Max deployment cost?
Eight nodes of 8x NVIDIA H100 80GB PCIe on Spot are $2.00 per GPU hour, so $128.00 an hour for the cluster, billed by the minute. A warm engine start costs $12.14 and the full concurrency sweep cost $8.46.
Can you turn thinking off on Qwen3.8 Max?
No. Every completion carries chain of thought, and reasoning shares the same max_tokens budget as the answer. The documented control is reasoning_effort, which takes low, medium or xhigh, and defaults to xhigh.
Why does Qwen3.8 Max need eight nodes and not six?
Six nodes hold the weights with 27.9 GB free per GPU, then fail on arithmetic. Tensor parallel 24 and 12 divide neither the 64 query heads nor the layer count, so no legal placement exists. Seven nodes fail the same test.
How long does Qwen3.8 Max take to start serving?
Five minutes 42 seconds from container start to a live endpoint with a warm page cache, or roughly ten minutes reading the 213 shards cold. Capturing CUDA graphs is 221.6 seconds of that and happens on every launch.
Subscribe to Hyperstack!
Enter your email to get updates to your inbox every week